Giving your workflow a structure
When your workflow grows, the workspace may become cluttered with overlapping tables. Typically, it's a sign that tables in the workflow should be moved to another one or more groups, where each group is located in a separate tab. One tab represents one group.
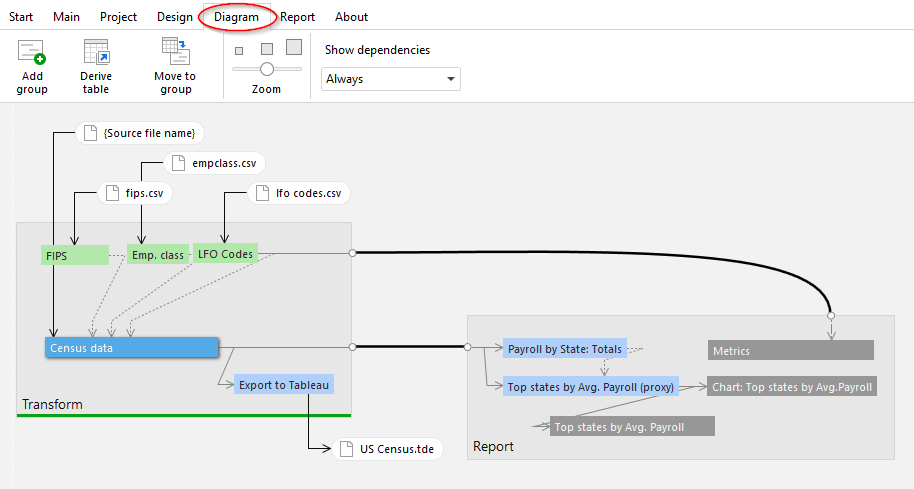
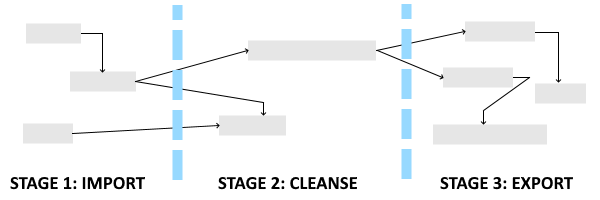
Data preparation workflows naturally have logical stages (or phases) where the result(s) of one stage becomes the input(s) of another. For instance, loading data can be one stage. Cleansing the loaded data is another. Aggregating the clean data and calculating metrics is a third stage, and so on. It is usually a good idea to have each stage of your workflow in a separate group (tab). Thus, you can focus on one stage at a time. You can always see the full workflow in the workflow diagram (explained in the Advanced topics below).
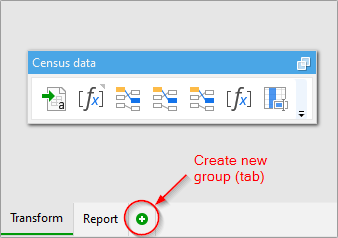
To create a new group, simply create a new tab in the workspace (just like you create a new sheet in Excel). When a new group is created, you can either create new tables in it by adding new data, or move tables from other groups (tabs). To move a table into another group, right-click the table's title bar and select "Move to group...". It is also possible to derive a new table in a new tab.
Actions in table in one group may reference tables from other groups. The order of tabs doesn't affect the order of workflow execution. Tabs can be moved left or right just by dragging them, or by using the group context menu invoked by right-clicking a tab.
Hint: To quickly switch between groups, press Ctrl+Tab, or Ctrl+Shift+Tab.
By organizing actions into tables, and tables into groups, you can logically structure and comfortably navigate complex workflows with hundreds of actions.
Arranging tables for clarity
In EasyMorph, data is an integral part of workflow. It makes the workflow logic very transparent under the condition that tables don't overlap. Therefore, to keep good visibility of the workflow logic, keep tables relatively small and avoid overlapping tables. If you need to look closer at the table's content, you can always maximize it and switch into the Analysis View specifically designed for table analysis. Don't put more than 5–6 tables in one group (unless some of them are minimized).
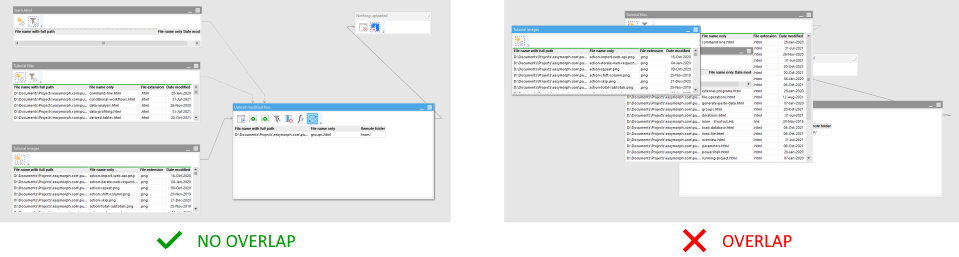
When tables don't overlap, you can clearly see the arrows that show dependencies between tables and actions. Also, since actions in tables are executed left to right, it's typically a good idea to allocate tables in a group also left to right.
Hint: Instead of scrolling, pan across the workspace by dragging the gray background between tables.
Naming groups and tables
For better readability, give tables and groups descriptive names. A group name should describe the workflow stage in that group. A few examples of good names for groups (notice the imperative naming style):
- Fetch raw data
- Check data quality
- Clean up
- Calculate attributes
- Aggregate
- Calculate metrics
- Export
Naming tables can be a bit tricky because they can represent a data entity or an operation, or both. When a table is referenced in an action, such as "Merge", the action consumes the result (final state) of that table. Therefore, it's usually a good idea to name tables after their outputs, not inputs. A few examples of good names for tables:
- Orders
- Orders with addresses
- Region lookup table
- Customer metrics weekly
- Export
If the purpose of the table is to perform an operation (especially an external one) then it may not have a meaningful data entity as its output. In this case, name the table after the high-level operation performed by the actions in this table. A few examples of good names for such tables:
- Export to database
- Upload modified files
- Send email notification
- Validate parameters
Hint: To quickly rename a table, press F2. Press Ctrl+F2 to select next table.