In EasyMorph you analyze data and answer spontaneous questions by transforming data on the fly (typically using the context menu on columns and cells). There are two main tools in EasyMorph that help understand data better: sandboxes and charts.
Charts
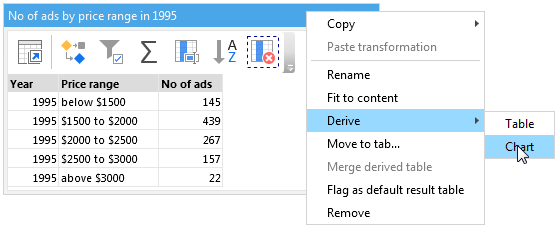
Charts are created similarly to derived tables — right-click a table and then choose Derive > Chart. Another option is pressing the "Derive chart" button in the "Design" menu.
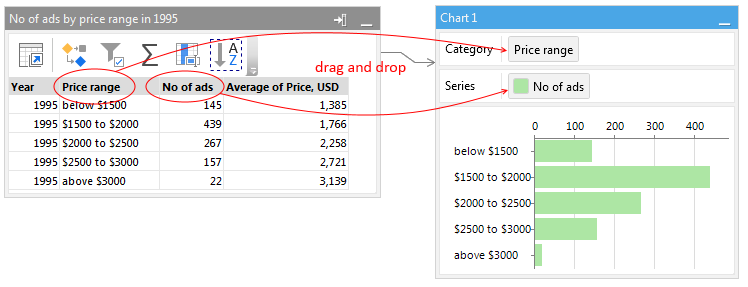
Similarly to derived tables, a chart is linked to the final table state, which is a result of the last action of the table. It means that when the source table changes, all linked charts (and derived tables) are automatically recalculated. To specify a chart category and series, simply drag column headers to the chart as shown below. To remove a category or a series, drag them from the chart to the gray work space, or right-click it and choose Remove.
Charts automatically aggregate data from the source table, and sort it using one of the three sort modes:
- By category (alphabetically)
- By series
- By arbitrary column
The last sort mode is convenient when you need to sort dates, that are represented as text, by their numeric values. In the image above, the category "Price range" is sorted by the field "Average of Price" from the source table. Sort modes are specified in the chart category properties in the side bar.
Hint: You can copy/paste charts into documents and presentations by right-clicking a chart and choosing Copy image.
Sandboxes
A sandbox is a temporary table that contains a static copy of an action result, or data pasted from the clipboard (e.g. copied from Excel or another EasyMorph project). Sandboxes start with the "Sandbox" action. Other than that, they are just regular tables. Think of sandboxes as EasyMorph-specific clipboards, or static "data photographs" not linked to any action.
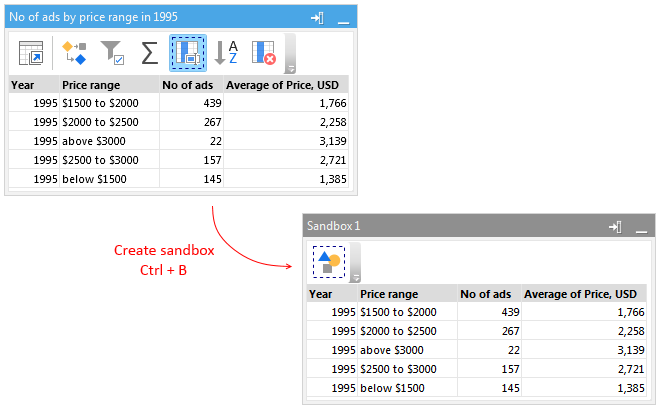
Most frequently, sandboxes are used for one-time analysis of an action output when, for example, you need to check data for duplicates, or find a certain value without making changes to an action chain. To create a sandbox with an action's result, right-click the action and choose "Send to sandbox", or press Ctrl+B. When a sandbox is created, you can apply actions to its data as with any other table. Note that actions in a sandbox are skipped (i.e. not calculated) when the sandbox is empty (i.e. contains no data).
Note that data in sandboxes survives reloads (i.e. remains unchanged), but is not stored with the project. When a project is opened, all its sandboxes are empty. Also, removing a sandbox can't be undone.
Another case for sandboxes is the comparison of states of the same table, but calculated using different parameter values. Since sandboxes survive reloads, you can run a project with one parameter (e.g. Year = 2015), send a snapshot of a table to a sandbox, then run the project with another parameter (e.g. Year = 2016) and compare the new state of the table with the one stored in the sandbox.
Sandboxes can also be used for bringing in data from Excel, or another EasyMorph project. For this, copy data onto the clipboard, then press "Add data" in EasyMorph and choose "Paste data". This creates a new sandbox populated with data from the clipboard. Alternatively, you can paste data into any existing sandbox.
Finally, with the help of sandboxes and the "Either table" action, it is possible to safely inject test datasets at any point of an action logic. For this, insert "Either table" into an action chain, and then link it to a sandbox. When the sandbox is empty, the action logic will work as usual. When some data is pasted into the sandbox, "Either table" will switch to using this data.
PDF reports
It is possible to generate simple PDF reports in EasyMorph. This can be helpful when you need to share results of analysis with people that don't have EasyMorph.
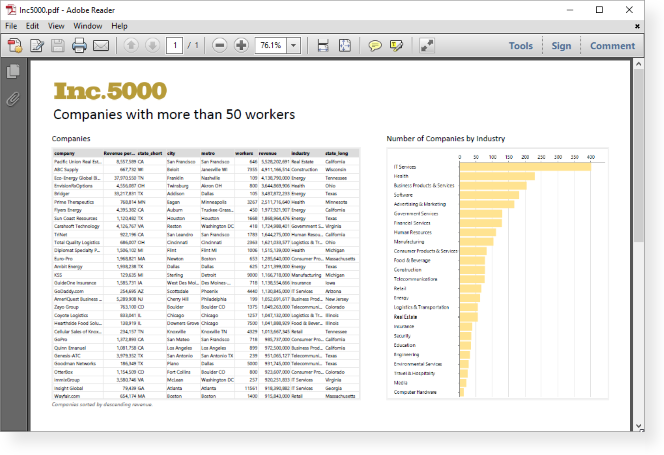
To design a report, go to menu "Report" on the main toolbar. EasyMorph will switch into the report design mode. In this mode, actions are not available. You can see tables in their final state, and charts. Adjust the sizes and positions of charts and tables. Hide charts and tables that are not needed. Add titles, text, and images if necessary.
Each project tab can be a report page — one page per tab. Once you have formatted the report objects, you can export particular tabs to a PDF file. Note that the name of the output PDF file can be defined as an expression, which is convenient for generating multiple PDF reports with different parameters (also from the command line).