Once you have data loaded into EasyMorph from one or more files or databases, the most common next step is to explore the data to check whether it makes sense and to find any issues with the data quality.
In the case of data quality issues, you may want to perform a more thorough analysis in order to understand the scale of the problem and whether or not there is any pattern to it.
This process is frequently called data profiling and EasyMorph includes many features which make it simple to perform, such as:
- The "Cell Metadata" dialog - used to profile individual cell values.
- The "Column Profiler" dialog - used for profiling all values in a column.
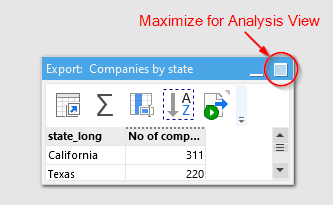
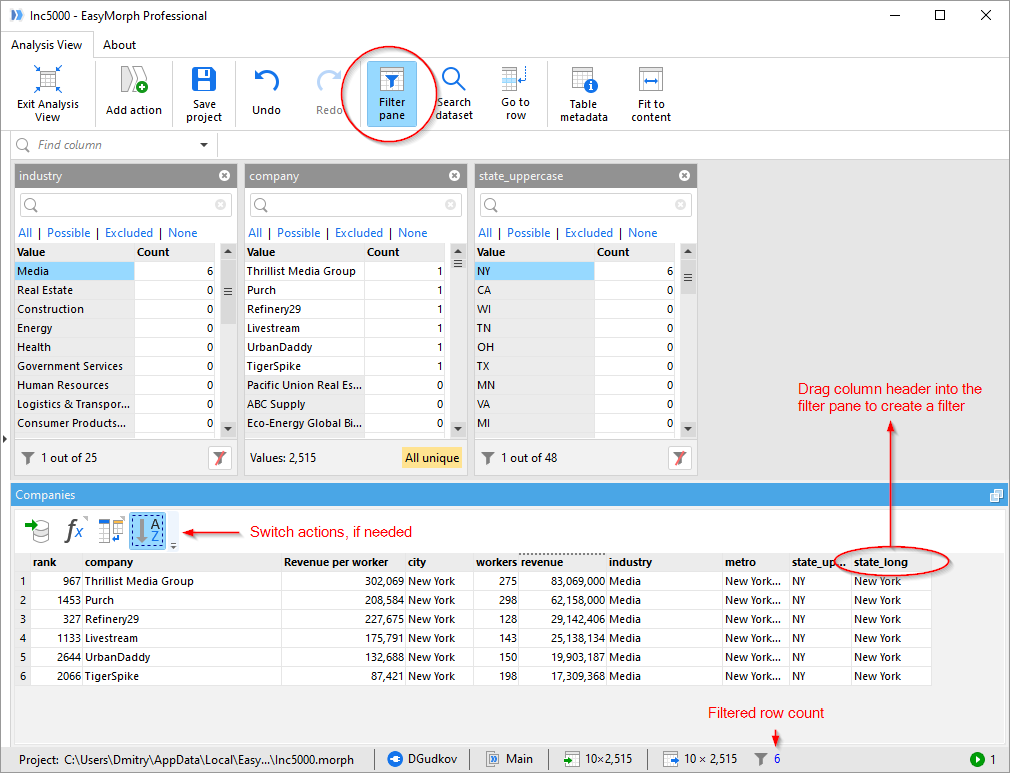
- The "Analysis View" - a powerful tool for viewing, instant filtering and exploratory analysis of an entire table of data.
Cell Metadata
The "Cell metadata" dialog is invoked by right-clicking on an individual cell in a table and choosing "Cell metadata" in the context menu. It displays the cell value, data type and and additional metadata. For example, in the screenshot below, with the help of the cell profiler you can see that the cell value is actually text, not a number.
Hint: The Cell metadata dialog is "Floating", meaning you can keep it open whilst clicking on different cells within any table, allowing you to quickly profile many values.
Column Profiler
The "Filter/Profile column values" dialog is invoked by double-clicking a column header within a workflow table. Alternatively, right-click the column header and select "Filter/Profile" in the context menu. The dialog displays information on the distinct values in the column, the data type(s) as well as any additional metadata. It can also be used to quickly apply "Filter" actions to the table.
Hint: Like the Cell metadata dialog, the "Filter/Profile column values" dialog is "Floating" too. Clicking on the column headers of other columns allows you to quickly profile and entire table.
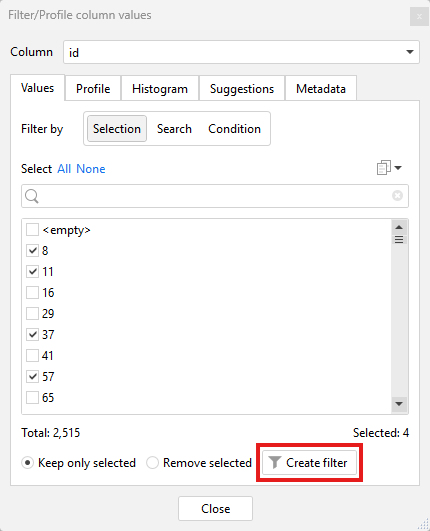
The "Values" tab shows a list of unique values in the column. If the list is long, it can be searched. Alternatively you can define a search or condition, both of which allow you to see which values would be returned if a filter with the search or condition was applied. Selecting one or more values by ticking the check boxes next to them and then clicking on "Create Filter", will add a "Filter" action to the the workflow using the selected values.
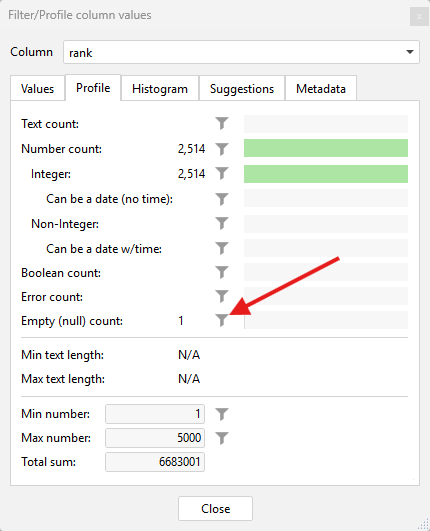
The "Profile" tab shows information regarding the types of data within the column such as the number of values of each type, any empty or null values and any errors. Clicking on the filter icons next to the data types will apply a "Filter by type" action to the table. Note that at dates are most commonly stored as numbers in EasyMorph, information about them is shown under the number count.
The "Histogram" tab shows a visual representation of the distribution of numeric values within a column. This can be useful for identifying outliers within the data that may be erroneous. Dragging the red "Min" and/or "Max" markers left or right allows you to select these outliers. Clicking on the "Filter range" button will add a "Filter by condition" action to the table matching the selected range.
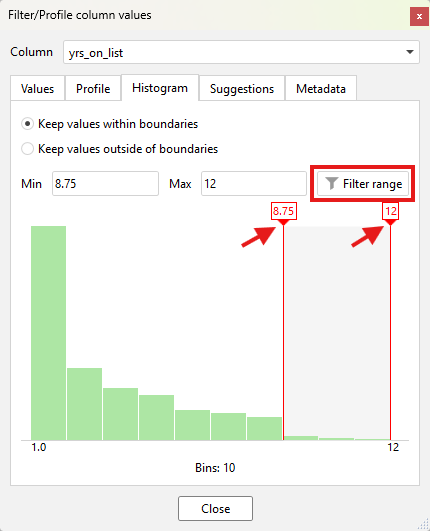
Hint: You can make the dialog bigger to increase the granularity of the histogram "bins" (also known as buckets).
The "Suggestions" tab shows where EasyMorph has identified potential anomalies or data quality issues which you may want to investigate. Suggested problems can include:
- Strings which only contain numeric characters may need to be converted to numbers.
- Text containing duplicate or trailing spaces.
- Text containing special characters.
- Text that is wrapped in quotes.
- Suspicious duplicate values when the majority of values are unique.
- Numeric values that are positive or negative when the majority of values are the opposite.
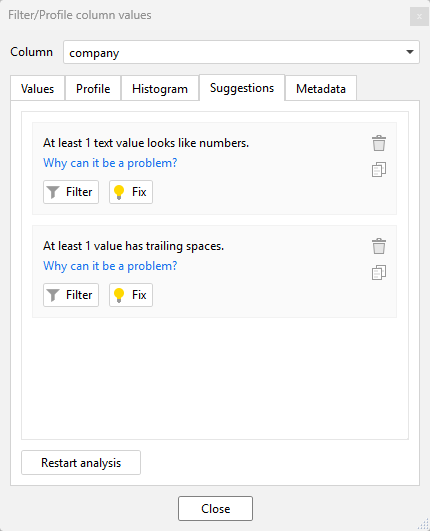
Clicking on the "Filter" button of any suggestion will add an appropriate action to the table to display the records where the problem exists. Clicking on the "Fix" button will add the relevant actions to resolve the issue. For example, where trailing spaces have been identified, a "Sanitize text" action will be added configured to remove them.
And finally, the "Metadata" tab shows any other metadata for the column, such as the original name (if the column has been renamed) and the number formatting being used when EasyMorph displays the column.
Table metadata
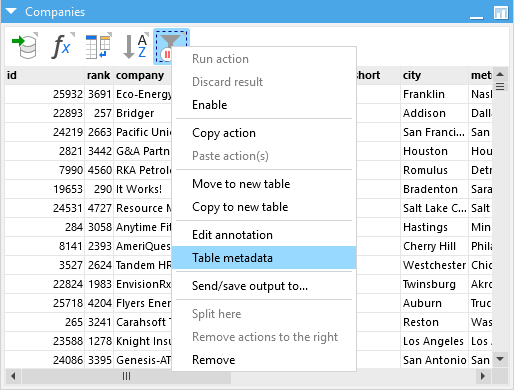
The "Table metadata" dialog provides a summary of the column profiles - similar to the column profiler describer above - but for all columns in a table. To access the dialog, right-click on any action in the table and select "Table metadata".
Note that the information provided in the table metadata dialog will be for the table as output by the action which you right-clicked. This can be useful for seeing how different actions have affected the data quality.
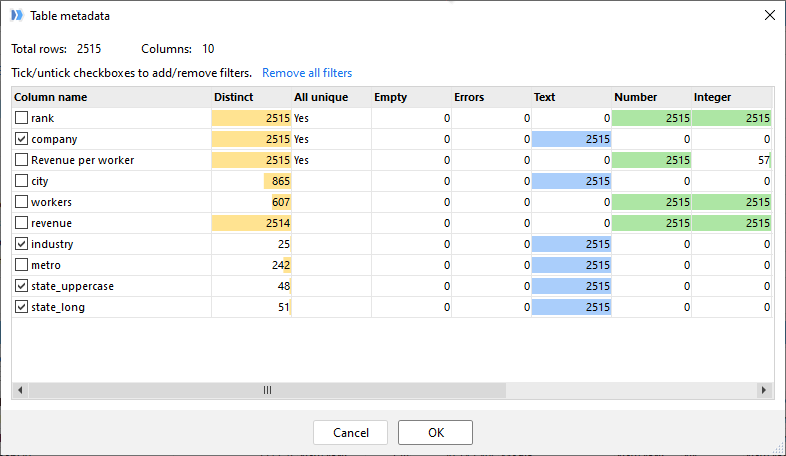
All numbers in the metadata summary table are clickable. When you double-click a number, a filter is added to the analysis view selecting only those values which contribute to the number. Alternatively, holding the Ctrl key whilst double-clicking a number adds a filter which excludes those values.