While Workflow Editor allows authoring workflows and datasets, Explorer is intended for consuming them. From a practical perspective, Explorer can be used by people for whom Workflow Editor is too complex, and they only need to retrieve and view the results of the workflows created by someone else.
To open Explorer, click the Explorer icon in the application bar on the left side of the application (see the screenshot above).
In Explorer, you can open files of the following types:
- EasyMorph datasets (.dset)
- EasyMorph projects (.morph)
Hint: EasyMorph projects must have a table flagged as the default result table. You can assign a table as the workflow result by right-clicking the table title bar and selecting "Flag as default result table" in the context menu.
When you open a dataset, Explorer loads and displays the dataset and its Analysis View.
When you open a project, Explorer immediately runs the project, prompts for parameters, if necessary, and displays the computed result dataset of the workflow (and its Analysis View). Effectively, the project is viewed as a "black box" for which you define inputs and obtain a result. Explorer doesn't expose the workflow itself and its internals.
Dataset Viewer
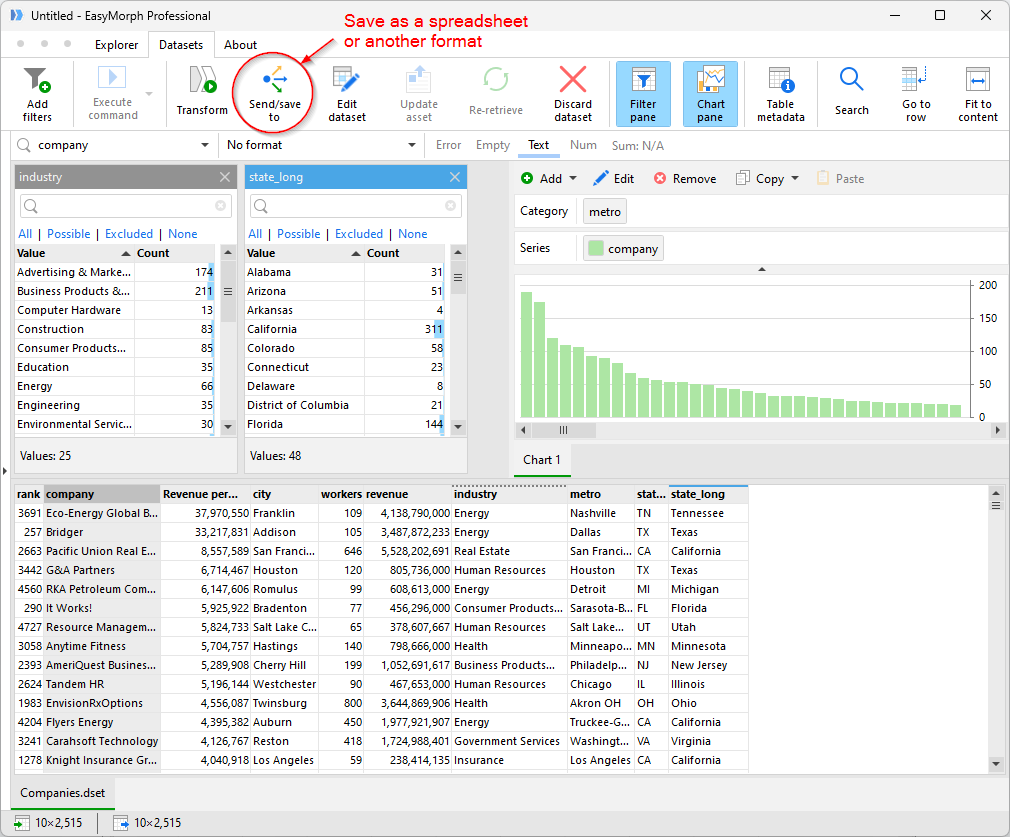
When you open a file, Explorer shows it in Dataset Viewer, which is very similar to the Analysis View described earlier in this tutorial.

You can do quite a lot with data in Dataset Viewer:
- Filter rows
- Export data into an Excel spreadsheet, CSV file, and a few other formats
- Sort rows
- Create and edit charts (data visualizations)
- Edit data — cell values and column names
- Find values
- Re-retrieve a computed dataset (i.e., a dataset computed by a project) with different parameters (e.g. for another date range)
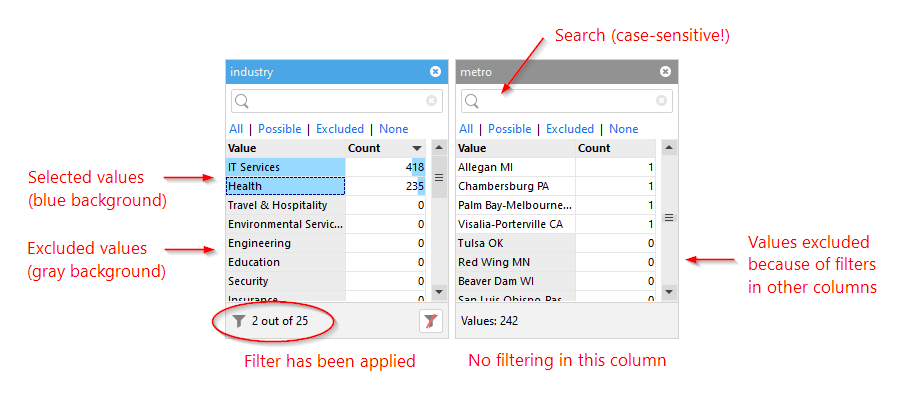
Filtering is an extremely powerful feature of the Dataset Viewer. It allows finding records, exploring relationships in data, and identifying data quality issues. It is especially convenient that the filters show not only the column values included in the current selection but also the excluded ones. To add a filter, click a column header and drag it into the filtering area (above the table), or press the "Add filter" button on the toolbar. Select one or more values in the filter, and press "Apply".

Hint: To quickly create an instant filter with a table value, simply double-click it in the table. To quickly create an instant filter that excludes a table value, Ctrl + double-click the value.
Charts in Dataset Viewer
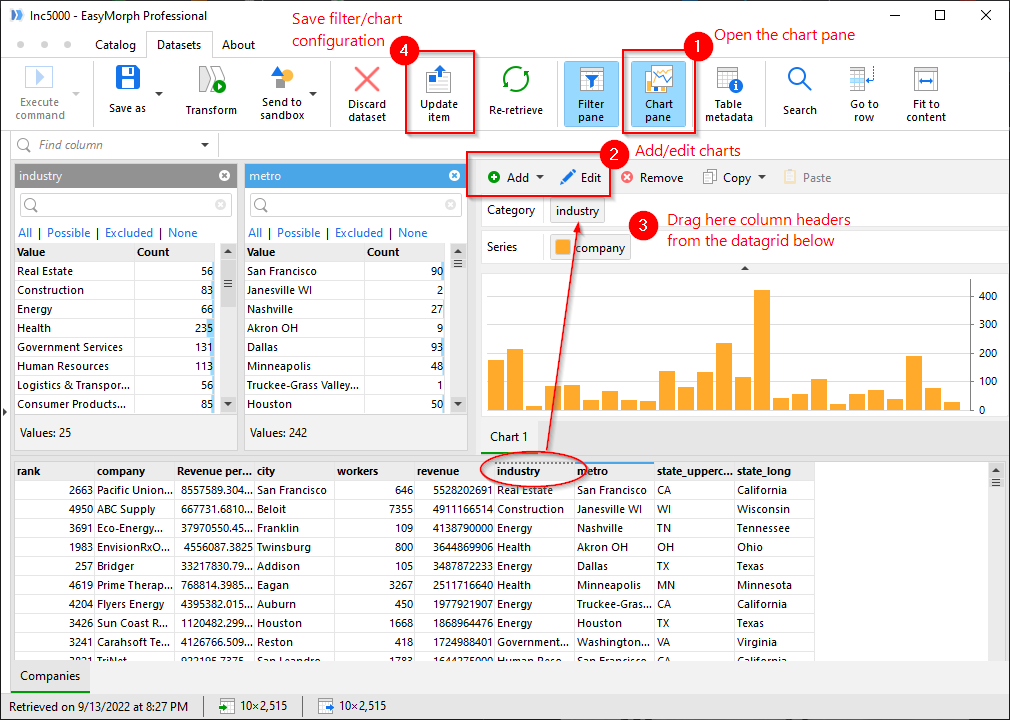
To help understand data, a dataset can come with charts that are also displayed in the Dataset Viewer. To open the chart pane, press the "Chart pane" button (1) on the main toolbar. The chart pane can contain one or multiple charts and cross-tables that are updated instantly when a filter is applied or changed.

To add or edit charts and cross-tables, press the "Add" and "Edit" buttons (2) in the chart pane toolbar. You can drag column headers right into the dropzones (3) of a chart or a cross-table.