In a very simple case, your project may consist of only one table with a few actions applied. However, with the help of derived tables you can build much more complex transformation logic. Derived tables is a cornerstone feature of EasyMorph. It is used in the vast majority of projects. You can see them in all examples.
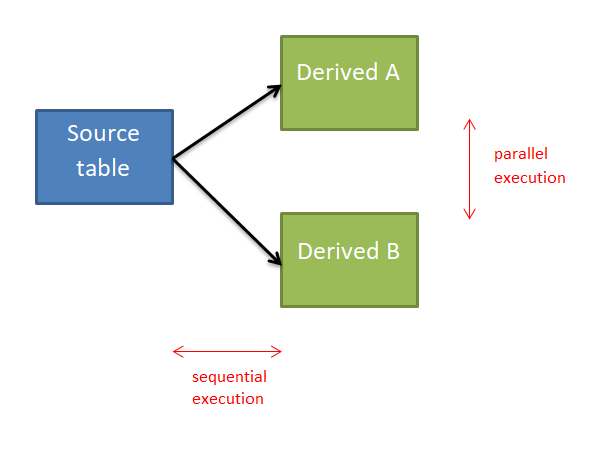
Derived tables are tables that are created not by loading data from a file or database, but by replicating a final state of some existing table. In other words, a derived table is a dynamic replica of another table. Dynamic in the sense, that when a source table changes, all tables derived from it also change. There can be many tables derived from one table. A derived table is a regular table that starts from the "Derive table" action. A derived table can be a source for another one or more derived tables.
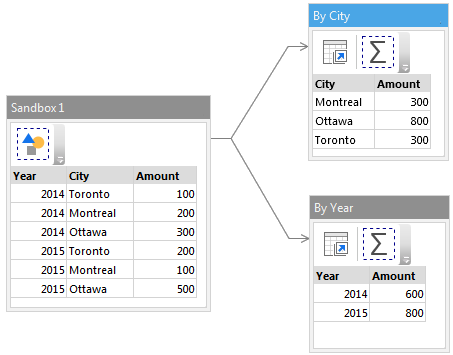
In the example below, a dataset is aggregated in two different ways, using two derived tables. In one derived table the dataset is aggregated by city, in the other, by year.

To derive a new table, right-click a table header and choose Derive > Table, or press Ctrl+D. There are several typical cases that are arranged with the help of derived tables:
- Calculate different aggregates based on the same data set (as shown above)
- Filter a dataset based on its aggregated metrics
- Branch calculation logic for different subsets of data in the source table
- Monitor data quality at certain points of a transformation logic
- Logically group actions
- Arrange self-joins
- Process data differently depending on a condition
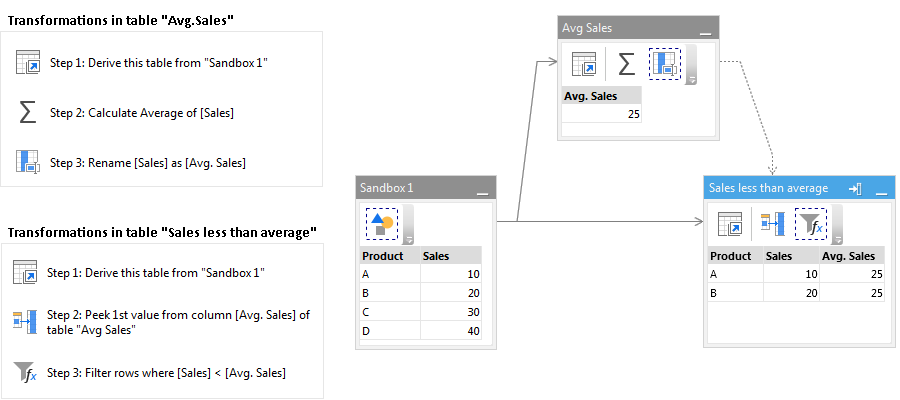
In the example below, table rows are filtered, and only products with sales less than average are kept. Table "Avg.Sales" is a derived helper table that is used to calculate the average sales amount. The "Peek" action (Step 2) appends the average sales amount from one table to another as a new column. Then in Step 3 table rows where Sales < Avg.Sales are filtered.


