Welcome to the EasyMorph tutorials! EasyMorph is a visual data preparation, analysis, and automation tool designed to help business professionals and data analysts to extract, analyze, merge, clean, transform, and move data without writing code.
These tutorials are intended to help you to understand EasyMorph, from the basic concepts to building your first data preparation and automation workflows, to more advanced features and techniques.
If you are eager to get started building your first workflow as soon as possible, you should begin with the Quick start guide which covers installing EasyMorph and the basics of building a data preparation workflow. Below and throughout these tutorials we’ll cover some of the same topics but in much more detail.
Getting the most from these tutorials
These tutorials are divided into 4 main parts:
- Workflow basics - The basic concepts and practical application of building a workflow to load, profile, filter, sort, transform, merge and export data.
- Advanced workflows - More advanced topics to develop your understanding of EasyMorph and to build complex workflows containing logic and
- Automation - Build workflows which don’t just prepare data but also automate the other related elements of the full end-to-end process.
- Hub - Topics specific to EasyMorph Hub.
It is recommended that you complete the “Workflow basics” part when you only start using EasyMorph, and then consult the other parts of the tutorial when the complexity of your workflow grows.
Many sections provide videos to help explain difficult concepts or to simply provide another way of learning. You can also check out our YouTube channel for many more videos about EasyMorph.
Note: EasyMorph Desktop contains many built-in tutorials and tips which popup as you begin working within it.
Hints, notes, tips and warnings
To highlight important information, throughout these tutorials you’ll find specific hints, notes, tips and warnings as shown follows:
Hint: A useful suggestion or shortcut that can make things easier or more efficient when working in EasyMorph. Think “Here's something that may help you.”
Note: Additional information that provides context or clarifies something in the tutorial. Think “Here's something you should know.”
Tip: Practical advice or a best practice to help you get the best results when using EasyMorph. Think “Here's a good way to do this.”
Warning: Important information about a potential problem, limitation, or unexpected consequence. Think “Be careful, this could cause a problem.”
Examples and downloads
Where relevant, you will find downloads of sample data files or example solutions so that you can follow along as you work through the tutorials. Downloads are displayed like this:
Download EasyMorph Desktop
Topics for power users
Many of the tutorials include a Topics for power users section at the bottom which delve into deeper and more advanced aspects of EasyMorph. If you are new to EasyMorph, feel free to skip these topics on your first walk through the tutorials. You can revisit them them later as your knowledge grows. There are buttons to jump to the next tutorial section immediately before these power user sections.
The EasyMorph platform
There are two main products in the EasyMorph platform:
EasyMorph Desktop
EasyMorph Desktop is a visual, no-code Windows application designed for building and running data preparation and automation workflows without requiring programming skills. Because workflows power most features across the EasyMorph platform, the majority of these tutorials are dedicated to working within EasyMorph Desktop.
EasyMorph Hub
Bigger teams of EasyMorph Desktop users frequently use also EasyMorph Hub - an enterprise, multi-purpose platform used to run, schedule, and collaborate on data preparation and automation workflows created in EasyMorph Desktop, as well as retrieve, explore, and analyze enterprise data.
Terminology and concepts
There are a few important terms and concepts used throughout EasyMorph and these tutorials which it is worth understanding first.
Note: Don’t worry if you don’t fully understand these terms at first. We’ll explore them in more detail as we progress through the tutorials and begin to build a workflow.
Actions and action chains
Actions are the individual building blocks within EasyMorph. Each action performs a specific task, such as loading a data file, sorting the data, filtering it, etc. There are more than 180 built-in actions in EasyMorph. This may sound like a lot of actions, but you don’t have to know all of them to use EasyMorph. You can start building practical useful workflows by learning as few as 10-15 basic actions. Once you master them, keep discovering new actions that will let you build more powerful and more useful automations.
To help you navigate all the actions, they are organized into 5 categories:
- Import — those actions that load data into EasyMorph from a file, database, business system or other source. Typically, workflows start with one of the import actions.
- Create — a small category that contains actions that generate data such as a list of files in a specific folder, a list of dates or a hard coded lookup table. They are typically used in more advanced scenarios, so beginners can ignore this category for now.
- Transform — actions that modify data in some way such as filtering it, sorting it, and calculating new columns. They majority of actions in your workflows will be from this category.
- Export — actions that do the opposite of import actions, i.e. they export the data from EasyMorph into a file, database or other system.
- Workflow — actions which don’t directly modify the data in EasyMorph, but which instead perform an external operation such as renaming a file, running another program or sending an email. This category also contains actions for building more complex workflows using loops, conditional branching, and other advanced techniques.
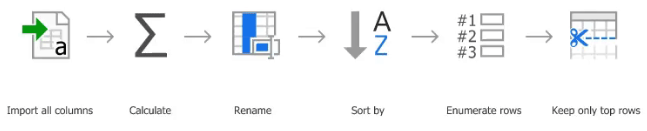
Actions are combined into sequences known as action chains. Actions in the chain are performed in order from left to right. Unlike in most other data processing and ETL tools, in EasyMorph you don't have to connect actions together. It is implicitly assumed that if one action is followed by another within an action chain, then the output of the first action becomes the input of the second, and so on.
Typically, a chain starts with an action that loads data, such as a spreadsheet, into EasyMorph. The actions that follow transform (or, we can say morph) this data step by step.
Note: There are no restrictions to the order actions can be placed in. Any action in EasyMorph can chain with any other action.
As we’ll see later, we can drag-and-drop actions to an action chain to add them. We can also drag-and-drop actions within a chain to re-order them.
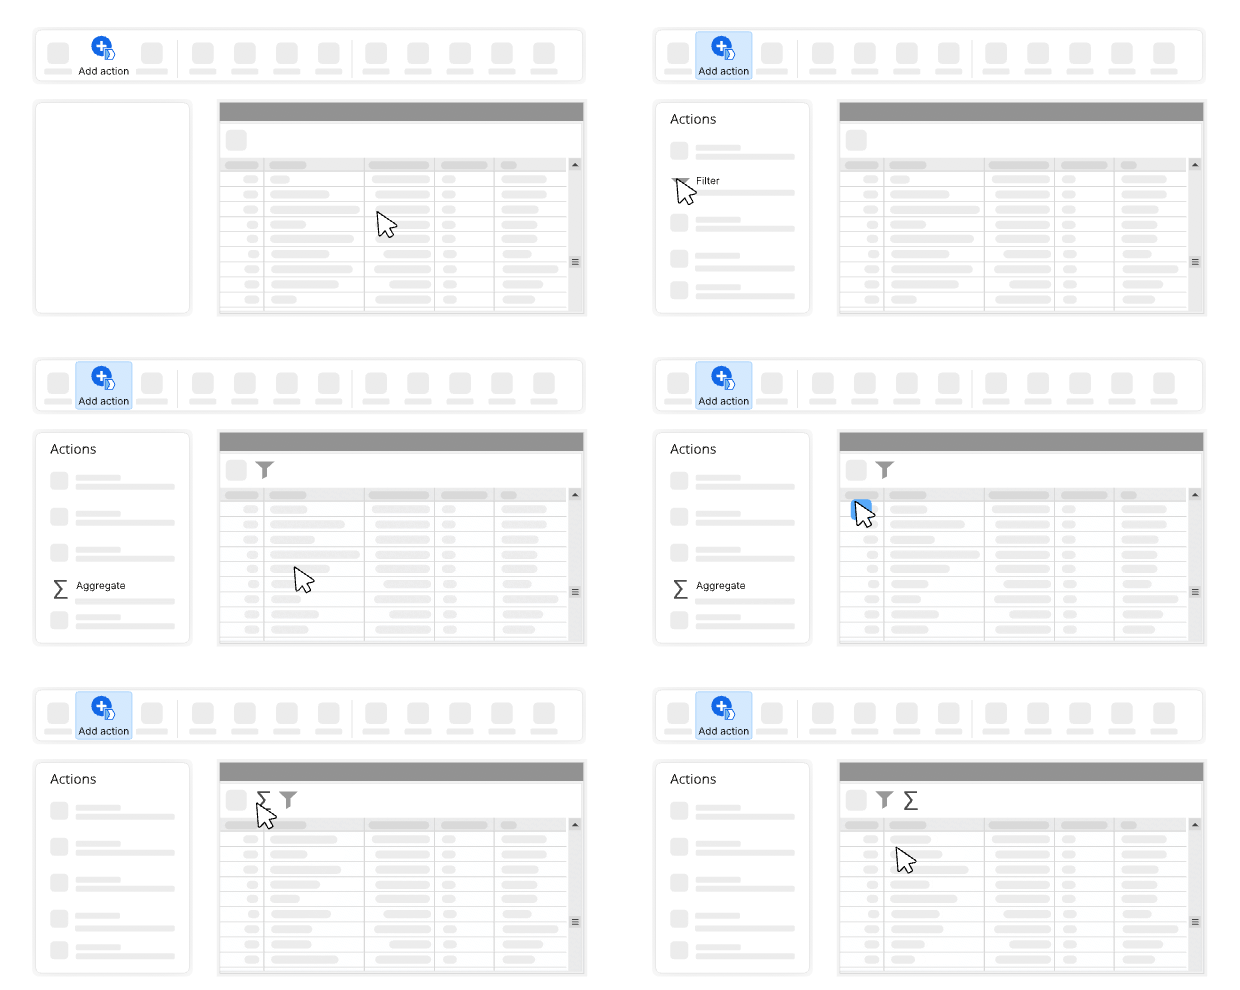
Hint: You can also drag-and-drop an action from one action chain to another. You can hold Shift and click on multiple actions to select and move them together.
Tables
A table represents a single set of data which is loaded into EasyMorph. Each table contains an action chain, defining how the data is loaded and the steps it is passed through. A table also contains a datagrid which allows us to see the data as it is at each action in the actions chain.
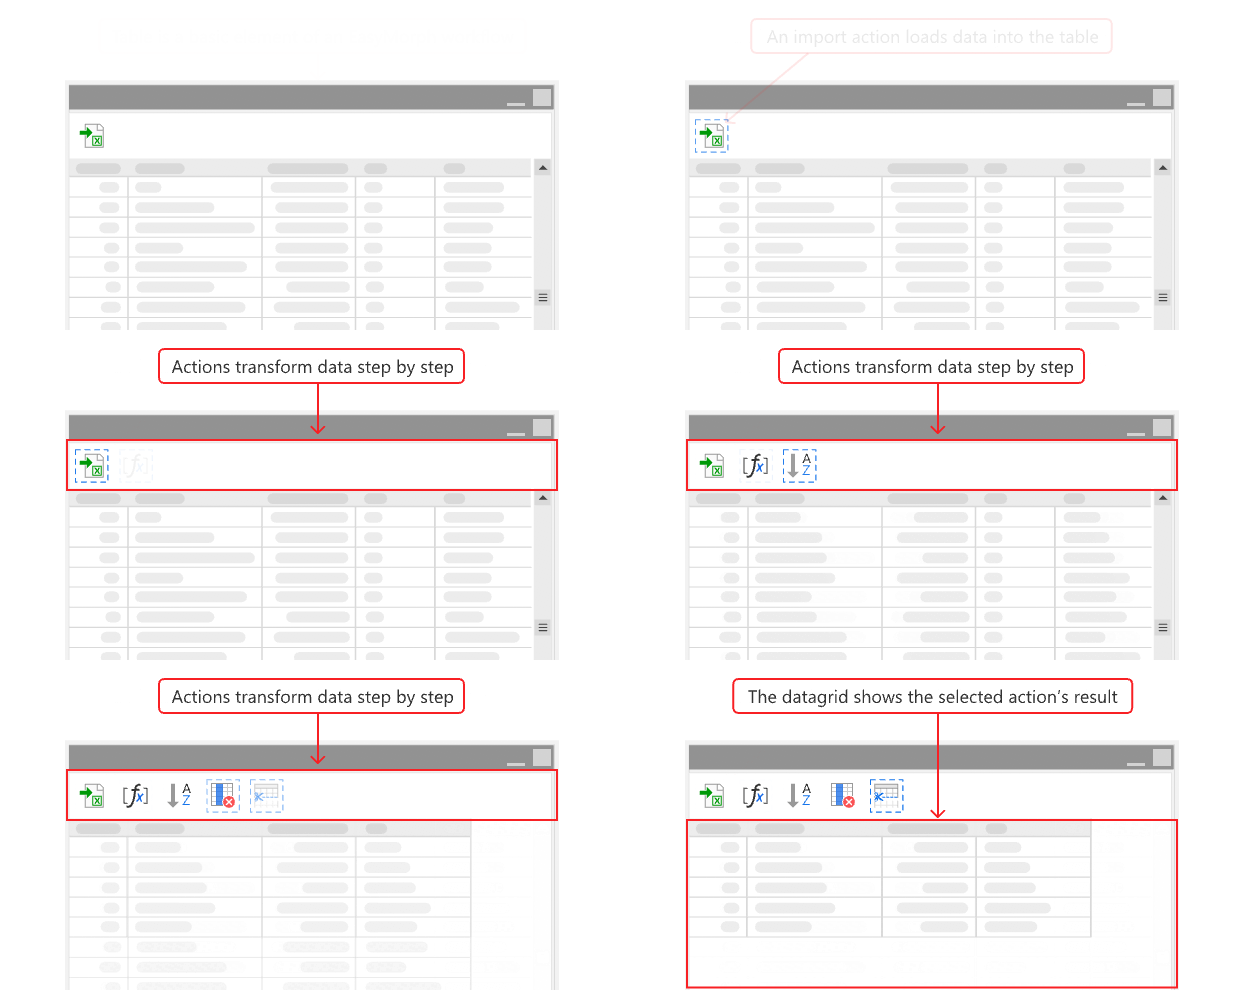
Selecting an action will display its output in the datagrid of the table. Clicking on each action one-by-one will therefore allow you to see how the action chain manipulates the data step-by-step.
Note: In EasyMorph, the table’s data grid shows us all of the data all of the time; not just a sample like in most other data tools. Thanks to EasyMorph’s data engine, this is true even when working with very large volumes of data on an average business computer.
Workflows
A workflow is the visual representation of all of the data processing and automation logic which we build. A workflow comprises one or more tables, which can optionally be linked together to allow data to flow from one table to another.
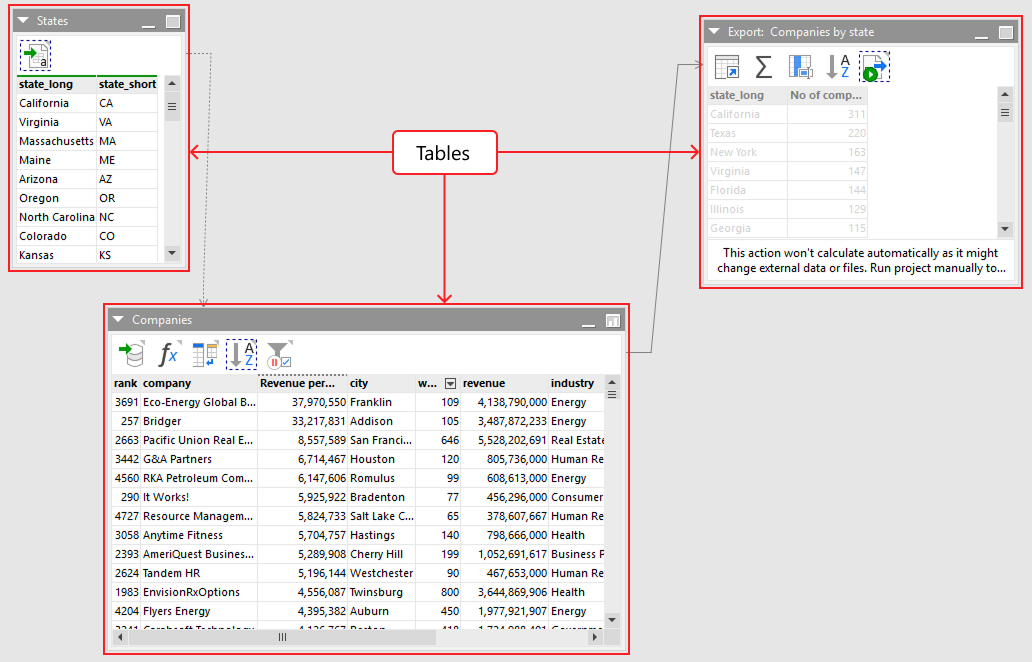
Tables can exist in isolation within a workflow, but they are most commonly linked together to allow data to flow from one table to another. There are 2 scenarios where this occurs:
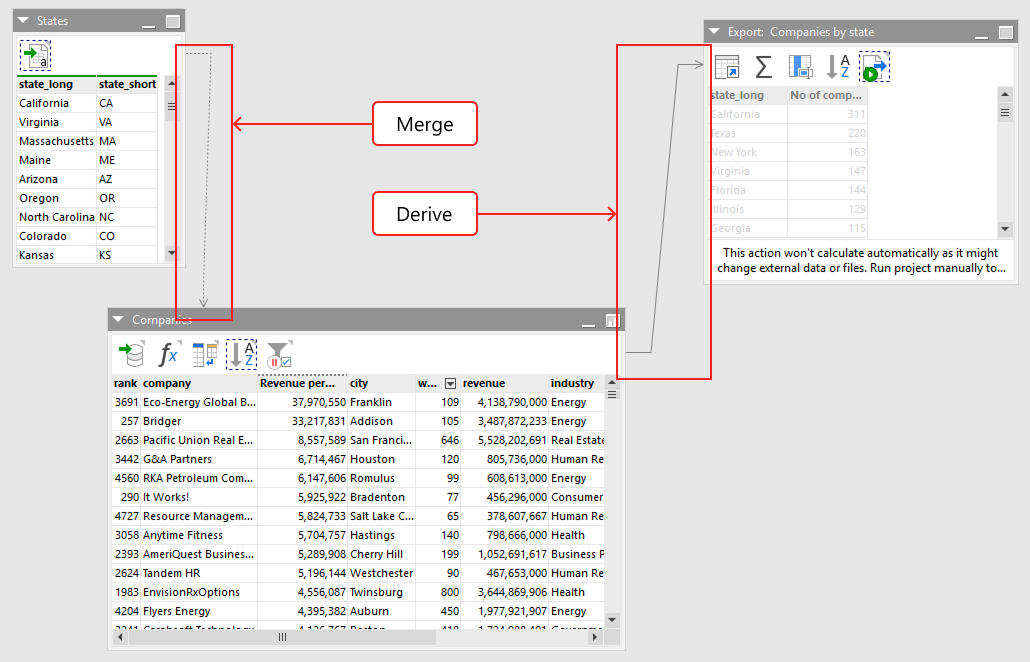
- Deriving — instead of beginning a new table by loading in or creating a new set of data, we can also derive a new table from an existing table. In this scenario, the data from the end of one table becomes the starting data of another. A solid arrow indicates the direction the data flows in between the two tables.
- Merging — if we use an action which merges one set of data into another (i.e. an append, lookup or join) then we see a dotted arrow showing the direction of the data.
Hint: Tables can be maximized, minimized, resized, and dragged around similarly to windows on your computer desktop. Maximizing a table will enable Analysis view.
Data analysis
Data analysis is an important part of EasyMorph’s philosophy. We believe that reliable, error-free data preparation requires a thorough understanding of data that you work with. To assist you with this task, EasyMorph provides many built-in tools to quickly visualize, analyze, and understand data at every step of your workflow. When designing workflows, it’s not uncommon to find yourself alternating between analyzing data and transforming it by adding actions. For instance, once you have imported data into EasyMorph, you may want to quickly analyze it to see if it’s correct. Or, after applying a transformation, you may want to quickly check if it did exactly what you expected it to do.
The range of data analysis tools available in EasyMorph include dynamic charts and filters, as well as various column and table profilers. All these tools are be covered further in this tutorial.
Projects
When we save what we’ve built in EasyMorph, it’s saved on your computer as a “.morph” file, also called an EasyMorph project. A simple project can contain just one workflow. That’s why the terms “project” and “workflow” are sometimes used interchangeably. However, a project can in fact contain multiple workflows and even reports (more on that later).
Note: EasyMorph doesn't store data in project files. Data is loaded and kept entirely in memory when a project is opened and run. When EasyMorph is closed, all the data it worked with is erased from memory. All calculations are performed only in the computer that runs the project. No data is sent to the cloud or another computer (unless you explicitly instructed EasyMorph to do so).
Other terminology
The following terms are also used throughout these tutorials:
- Desktop - refers to EasyMorph Desktop.
- Hub - refers to EasyMorph Hub.
- Dialog or Dialog box - refers to an additional temporary windows which opens whilst using EasyMorph. They commonly provide additional information or guide you through specific configuration steps.
Navigating EasyMorph Desktop
The large number of features and capabilities of EasyMorph Desktop can make locating things tricky at first. Once installed, we can open EasyMorph Desktop in the same way as any other application.
At the very top of Desktop we see a series of navigation tabs, similar to those found within Microsoft Word or Excel.
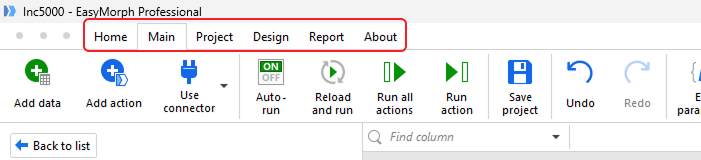
We predominantly use the first two tabs, Home and Main, so let’s focus on these for now. We’ll introduce the others where relevant later in the tutorials.
The “Main” tab
The Main tab is where you will spend the most time when working within EasyMorph. It is where we create, edit and execute our workflows. It is sometimes referred to as the “workflow editor” for obvious reasons. It is comprised of 3 main sections:
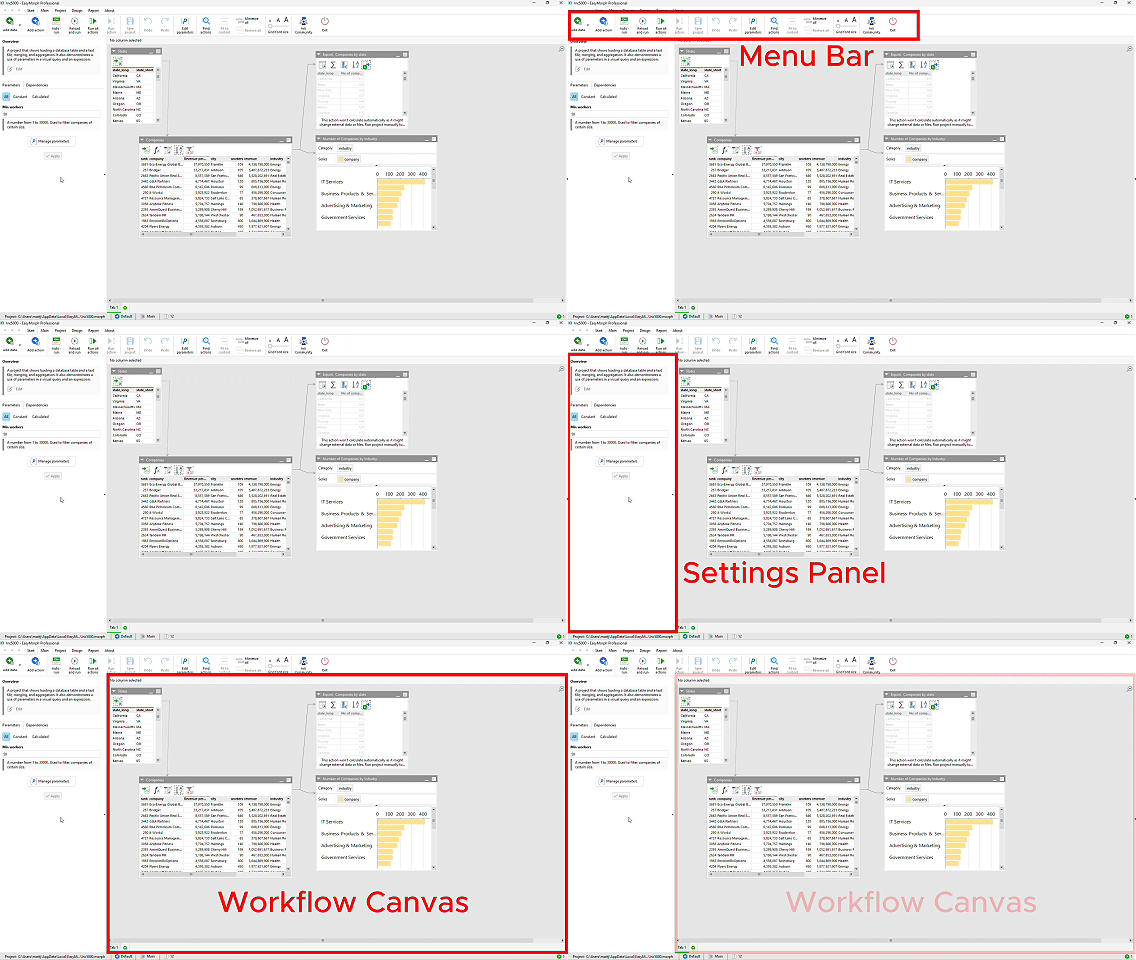
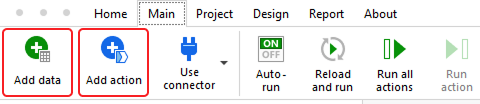
At the top is the navigation bar, also called the “ribbon” menu. This bar contains buttons for adding elements to our workflows, opening and saving projects, etc. When building or modifying workflows we mainly use the two button on the left of the navigation bar: Add data and Add action.
To the left is the settings panel. This panel shows us relevant information and settings for whichever element of the workflow we select. For example, if we select a single action, the settings panel will show us all of the settings for that action.
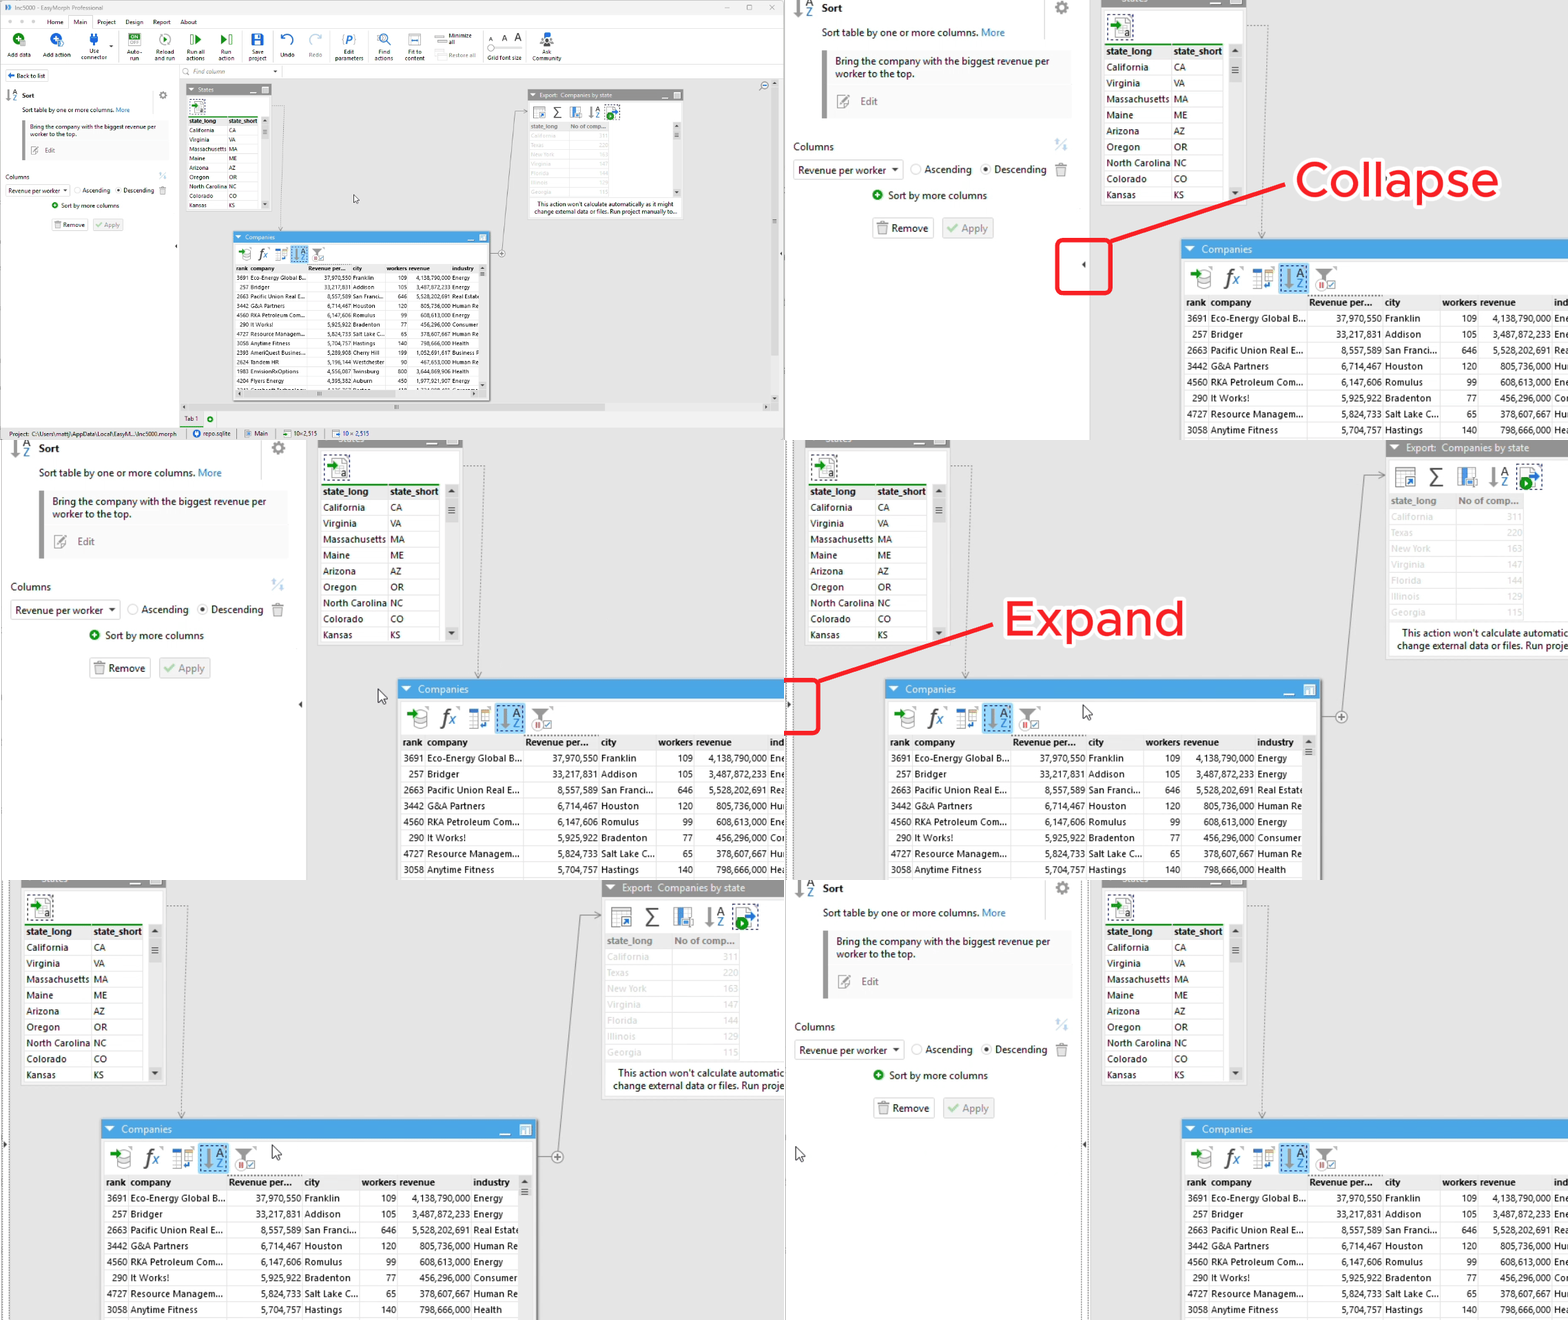
Warning: If you can’t see the settings panel, it is likely collapsed. The settings panel can be collapsed and expanded as needed using the small arrow found along its edge.
The rest of the screen is taken up with the workflow canvas (also called the workspace). This is where we can see the tables and their actions which make up our workflow as we build and edit it.
Selecting elements of a workflow
When building and modifying workflows, the settings panel and workflow canvas change what they display depending on what element of the workflow we have selected.
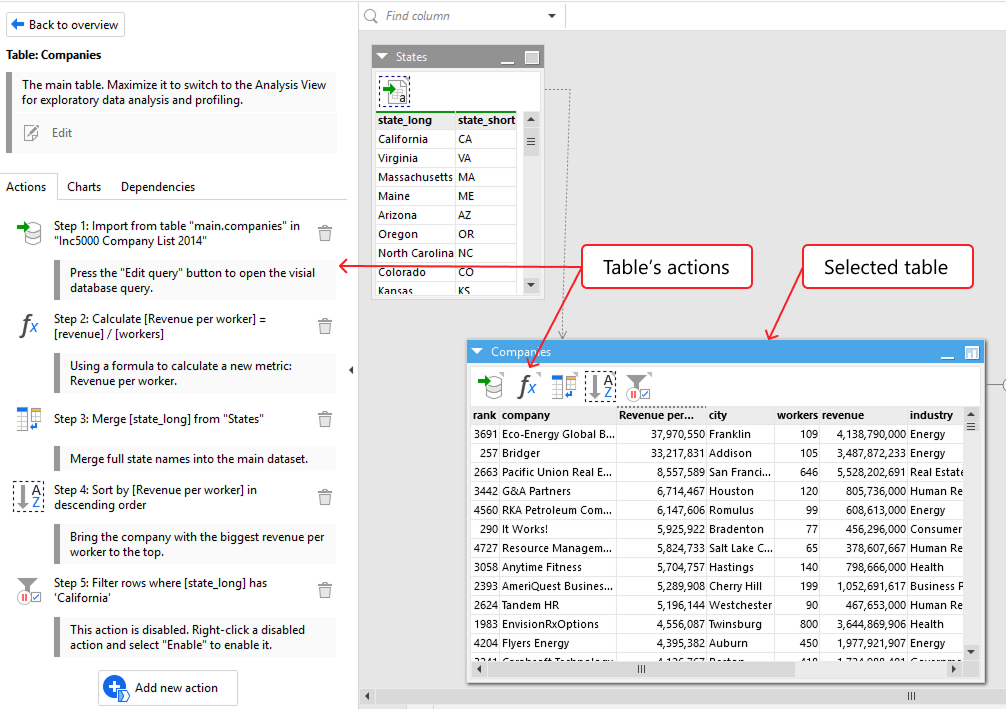
If we select a table by clicking on it’s header, the table’s header turns blue to indicate it has been selected. The left-hand settings panel shows a list of the actions in the table’s action chain; displayed vertically instead of horizontally. Each action has a short automatically generated description of what it does. As within the action chain, actions can me reordered by dragging and dropping them within the settings bar instead. We can also click on the action in the settings panel to select them.
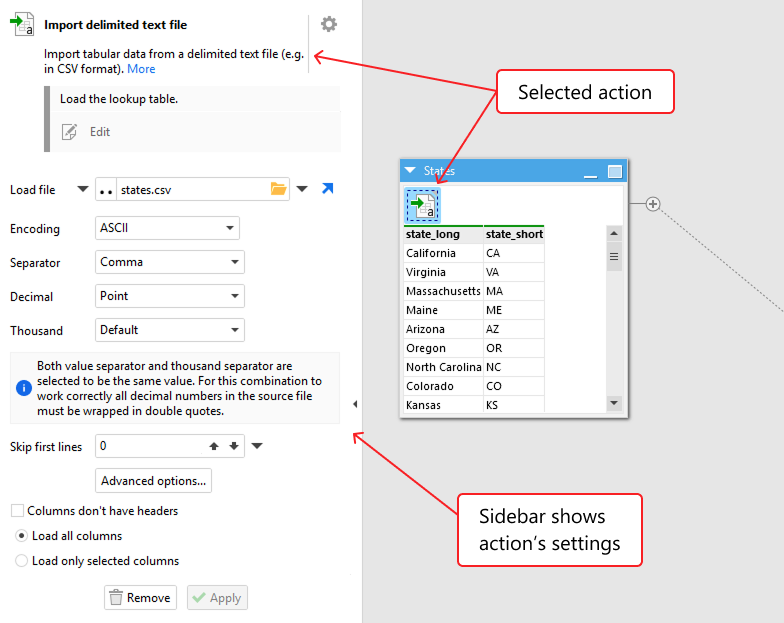
When we select an individual action (either within a table’s action chain or the settings panel), as explained above, the table’s datagrid shows us the data as output by that action. Additionally, the settings panel shows us all of the settings and configuration for the selected action.
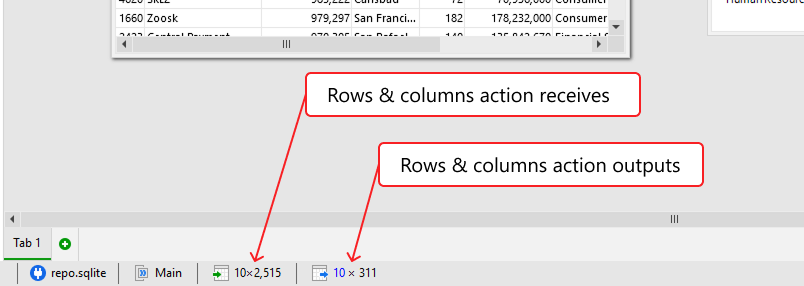
Additionally, just below the workflow canvas is an information bar which shows various information. Most notably, when we select an individual action, this bar shows us two important pieces of information:
- The number of columns and rows of data which the selected action receives from the previous action (if any).
- The number of columns and rows of data which the selected action outputs.
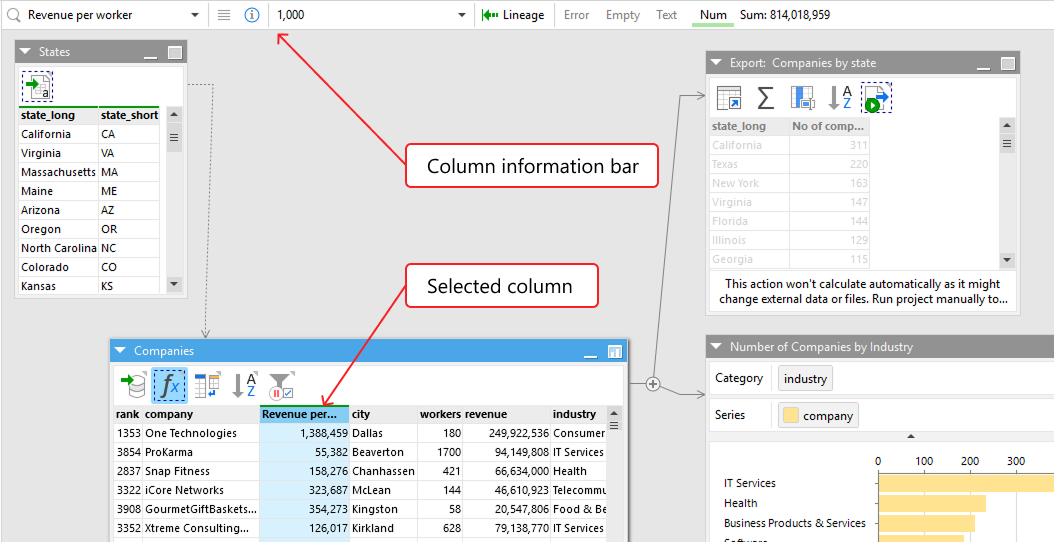
When selecting an individual column in any table, another information bar at the top of the workflow canvas shows information about the data in the column.
This column information bar also contains options for how the data in the selected column should be displayed in the table’s datagrid.
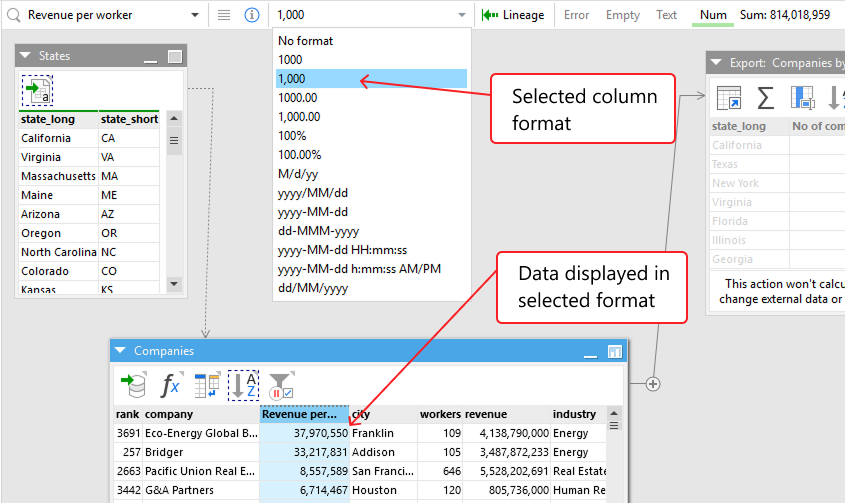
Warning: Changing the display format of a column does NOT modify the data in any way, only how it is displayed whilst working with it in EasyMorph. If the data is exported from EasyMorph to a file, database or business system it will therefore NOT be formatted based on this option.
Right-click menus
You can right-click on many elements within the workflow canvas to access additional option and quick-link menus. You can right-click tables, actions, columns and even individual cells in the datagrid. For example, if we right-click on an action we see a menu with options to copy it, remove it, enable or disable it, etc.
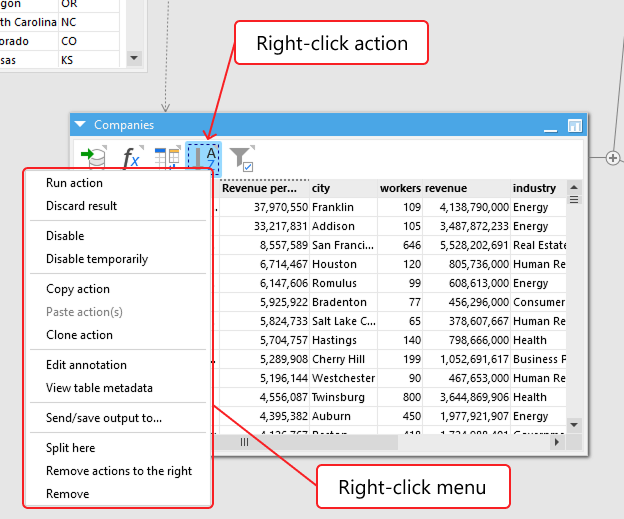
The “Home” tab
Other than when opening EasyMorph for the first time or when opening an existing project file, the Home tab is where we begin. It contains lots of links to access features, recent projects, other resources and much more.
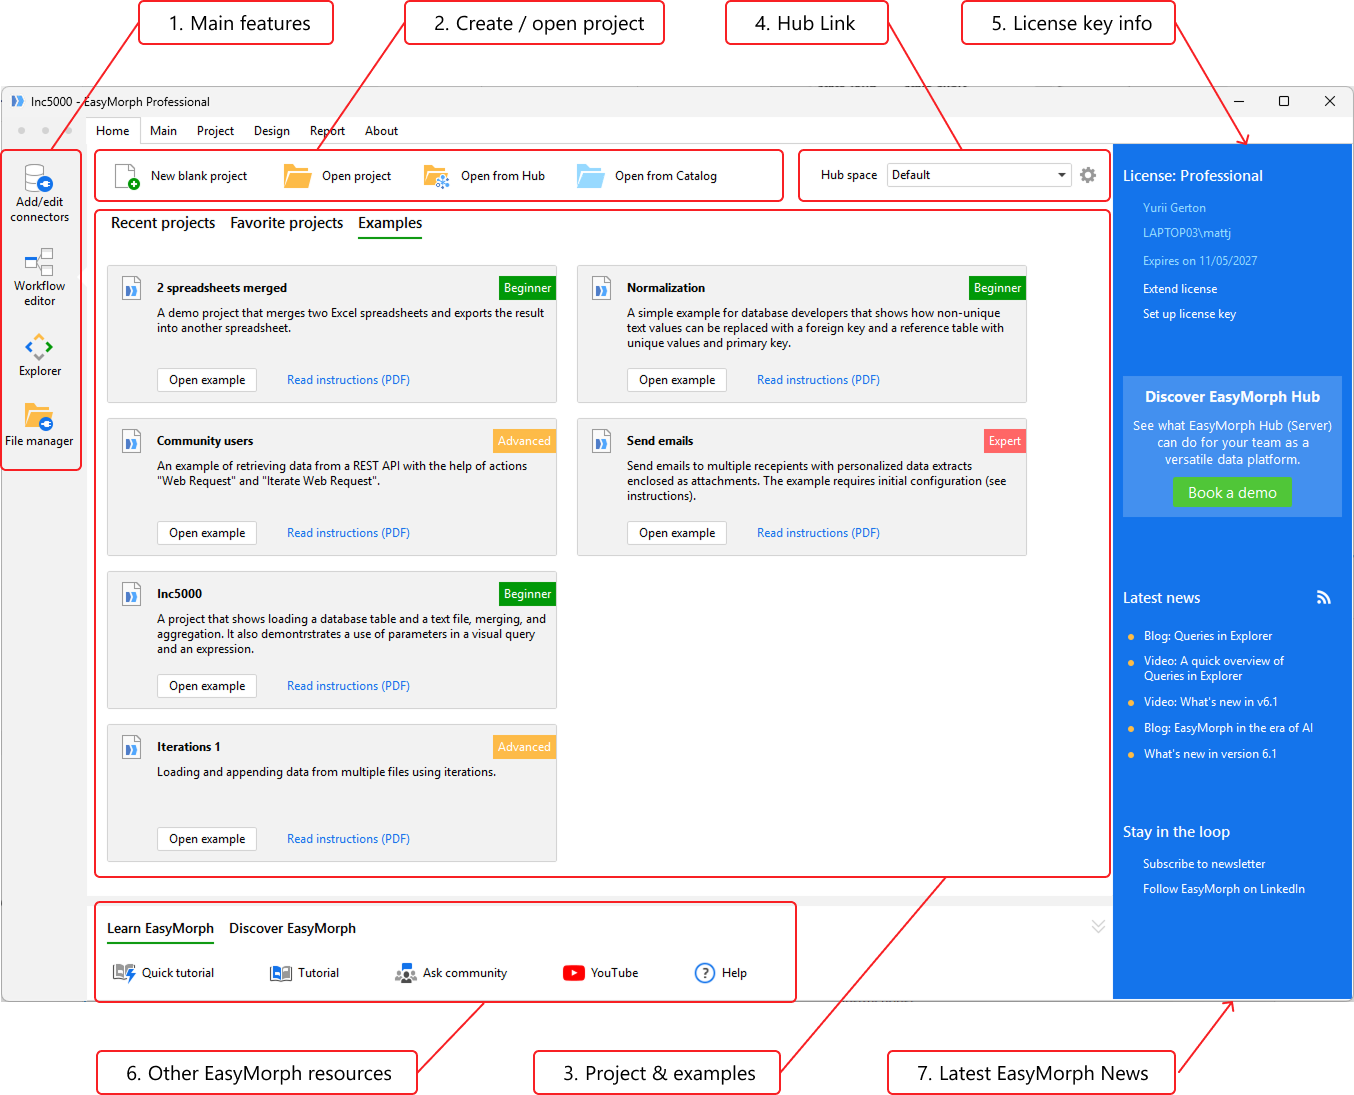
- On the far left are 4 buttons for each of the main features of EasyMorph Desktop. "Add/edit connectors" allows you to manage connectors to databases or systems. "Workflow editor" takes you to the main workflow editor within EasyMorph we discussed above and will be the default feature when EasyMorph opens. "Explorer" allows you to work with EasyMorph Hub to create and manage boards and catalog assets. A link to an EasyMorph Hub is required for this area to work. File Manager" allows you to manipulate files stored locally or on an EasyMorph Hub if connected.
- At the top we have quick links to create a new project or open an existing project from either our local computer or a connected EasyMorph Hub.
- The majority of the center is taken up by either a list of recent or favorited projects, or the example projects which come with Desktop. We cans switch between them using the links at the top of the list.
- Towards the top right hand corner you will find an option to link EasyMorph Desktop to an EasyMorph Hub if you have one.
- At the top of the blue bar on the right is information regarding your license key if you have one applied, as well as options to apply or manage your license key.
- At the bottom are links to helpful resources including these tutorials, the EasyMorph Community forum and our YouTube channel.
- The bottom section of the blue bar on the right contains all of the latest news and announcements from EasyMorph.
Summary
You should hopefully now have a basic understanding of EasyMorph, the concepts and terminology, as well as knowing your way around the core features. You’re ready to start building workflows to prepare and automate data like a pro.