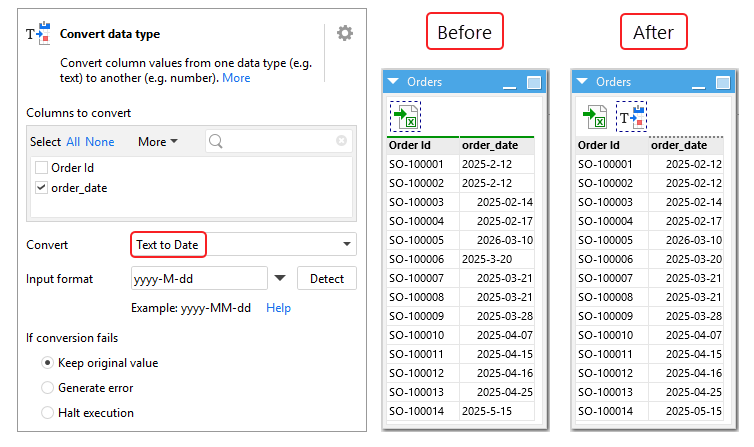
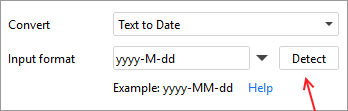
With our data loaded into EasyMorph, filtered to keep only what we need, and explored and profiled to understand it, the next (and crucial) step is to cleanse our data.
What is data cleansing?
Data cleansing is the process of detecting and correcting errors and inaccuracies in our data. This can involve a variety of operations such as removing unwanted characters, fixing decimal separators or deduplicating rows.
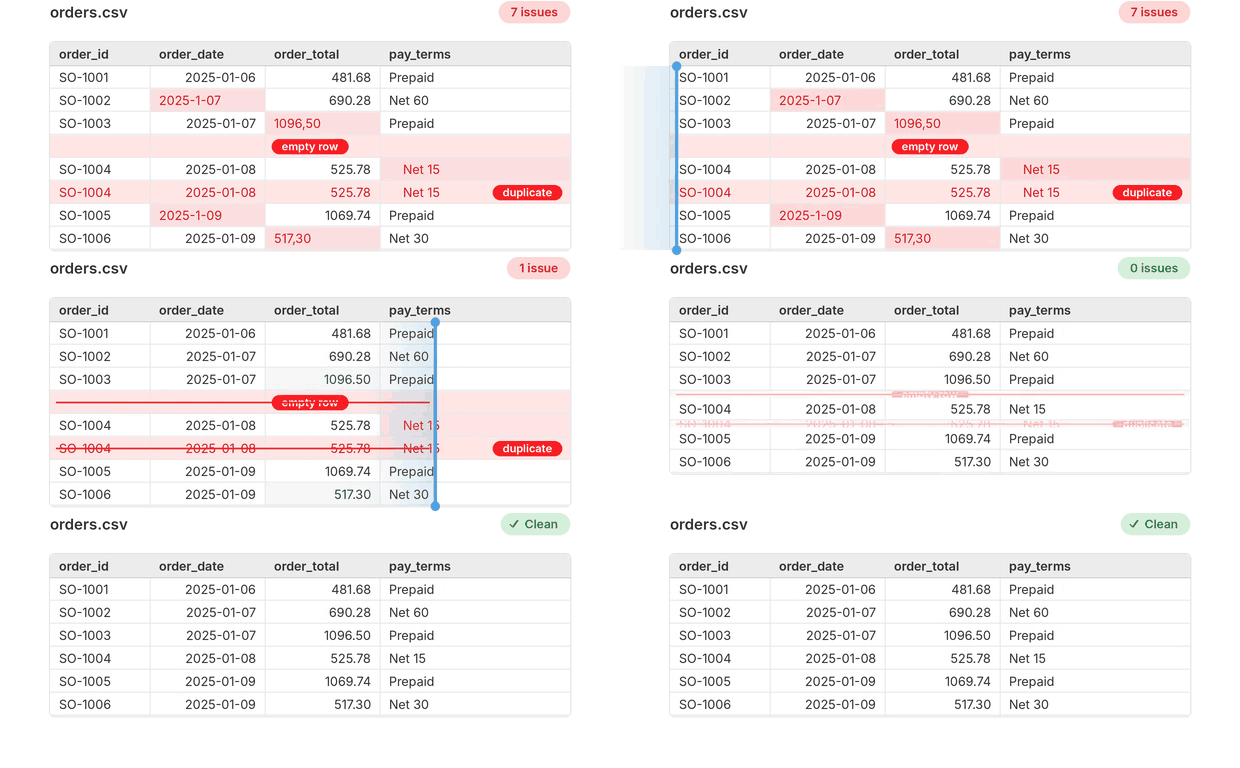
Cleansing data before proceeding with further transformations and automations is very important as it saves a lot of trouble down the line. For example, let’s say we’re an online retailer, and want to obtain the total revenue from customer orders. However, some of the customer orders are duplicated, and this error slips through undetected. This makes the total revenue KPI higher than it actually is, which may lead to incorrect business decisions with far-reaching consequences. Therefore, taking special care to ensure our data is accurate and well-formatted is essential.
Finding errors and inaccuracies in our data
EasyMorph is packed with tools and features to help us to spot potential problems in our data which we may need to cleanse.
One of the key features of EasyMorph is that we can see the full data we’re transforming at every step, in real time. This means that we can more easily spot data errors that might need cleansing.
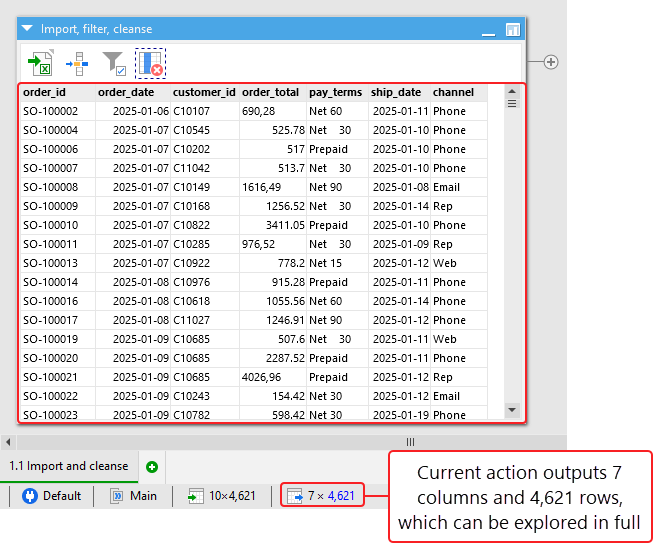
EasyMorph also provides a complete set of data profiling tools, which may reveal underlying issues in our data. For example, we can easily detect if there are text values in a column where all values should be numbers, such as a column for a price or a quantity.
EasyMorph Insights
One of the most helpful tools for identifying potential problems with our data is Insights. When loading data into EasyMorph, it is automatically checked for possible data quality issues. If anything is found, EasyMorph provides insights, which not only alerts you to the potential problems but also allows you to fix many of them with a single click.
Important: Providing dataset wide insights can be intensive when working with large dataset. Therefore by default, automatically calculating full dataset insights is disabled by default. To enable them, turn on the Auto-calculate full dataset insights option in the Application settings found on the top navigation bar on the About tab.
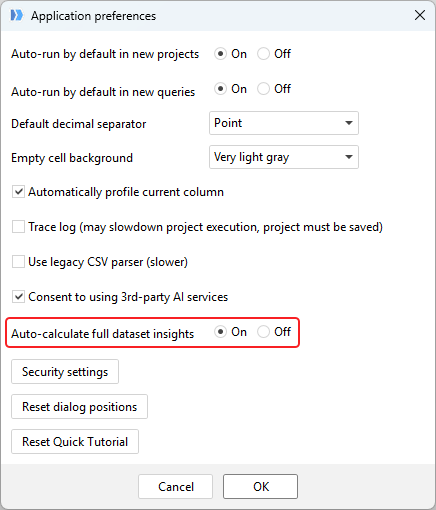
Just some of the Insights EasyMorph provides include:
- Text which contains leading or trailing spaces, or multiple spaces anywhere in the text.
- Values that appear to be numbers but which are stored as text
- Text containing special characters
- Suspicious duplicate values when the majority of values in the column are unique
- Text that is wrapped in quotes
If there are any potential Issues found, EasyMorph displays a lightbulb icon in two different places:
- In the table’s header bar when the table is selected - opens the “Dataset Insights” dialog
- In the column information bar (when a column within a table is selected) - opens Insights in the Column Profiler dialog
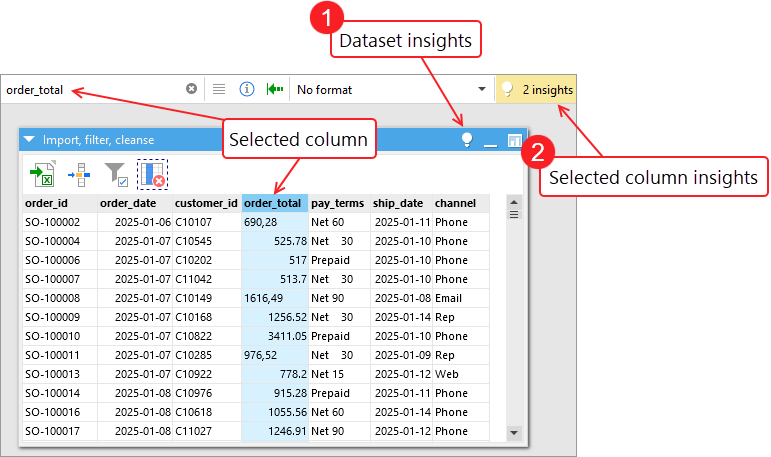
The Dataset Insights dialog
When clicking on the lightbulb icon on the header bar of a table, the Dataset Insights dialog appears, listing all columns with one or more insights, as well as how many potential problems were found. Clicking on a column on the left of the dialog will show the details of the insights on the right.
In the insights details, clicking on the Filter button of any suggestion will add an appropriate action to the table to display only the records where the problem exists. Some insights also have a Fix button which when clicked will add the relevant actions to resolve the issue.
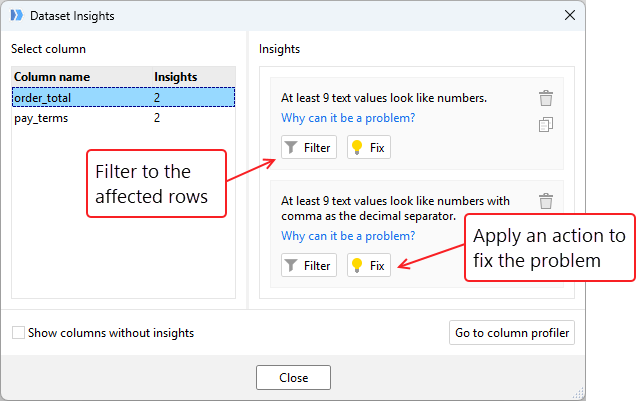
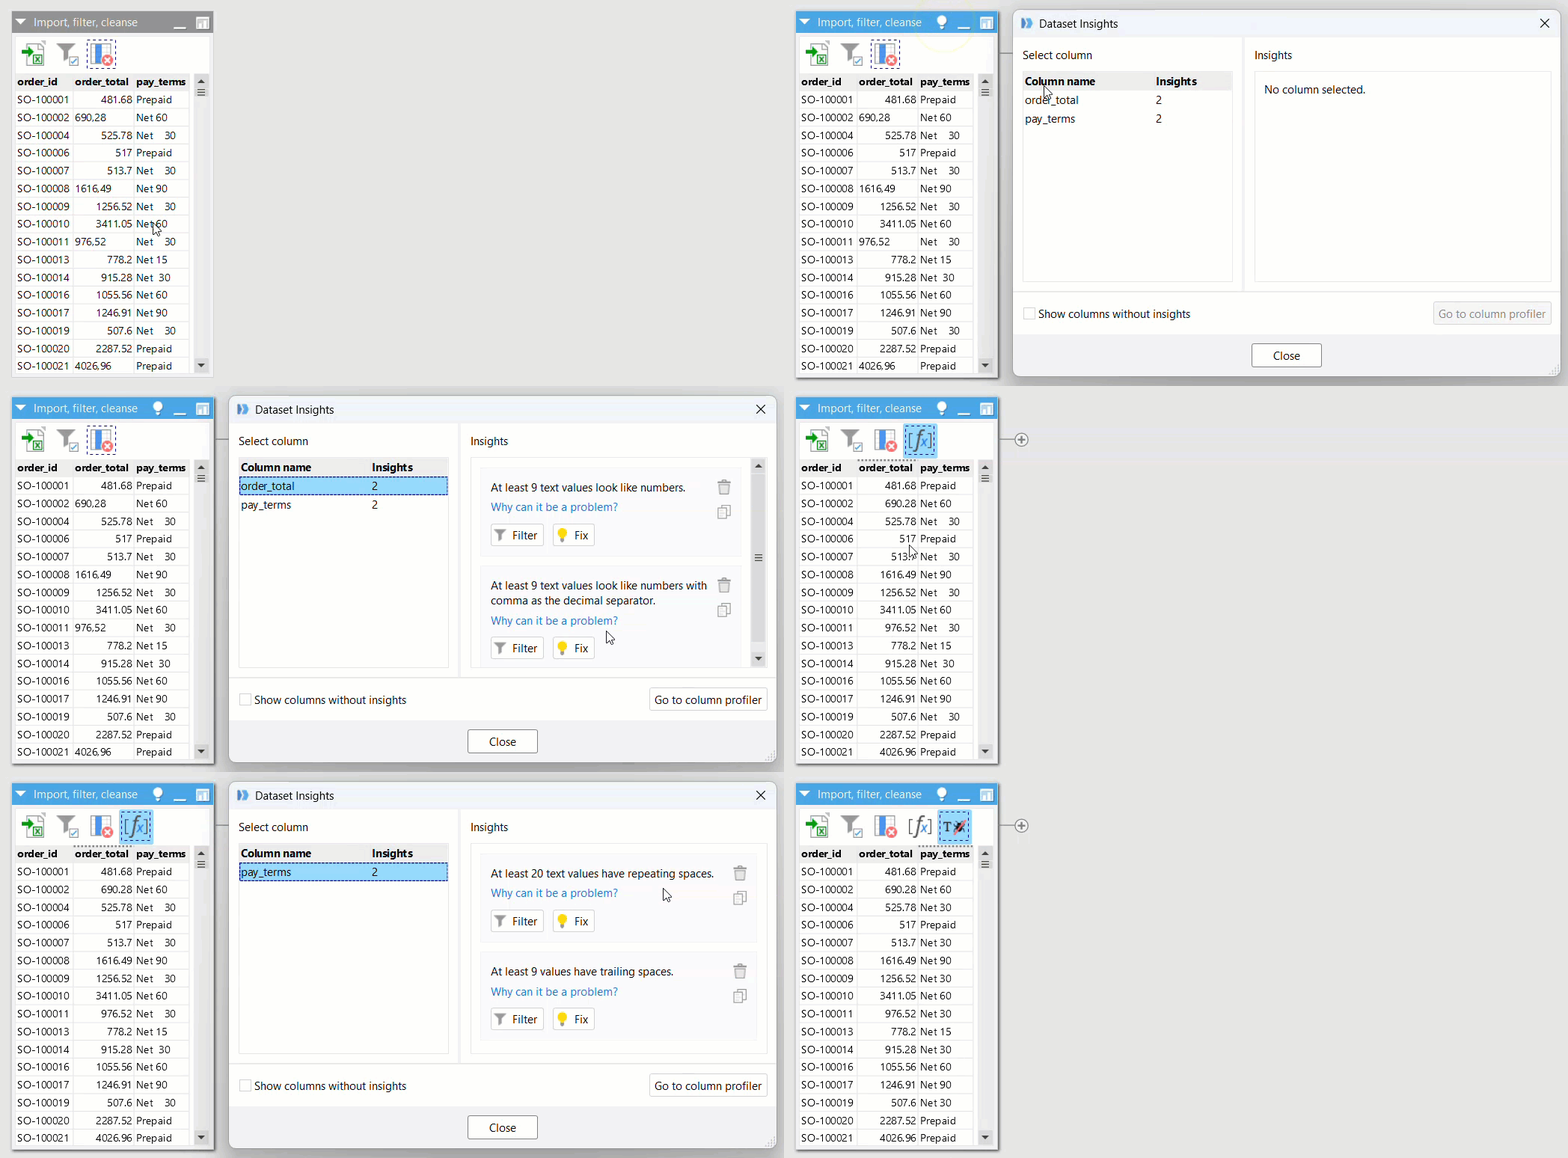
In the below example, EasyMorph has found insights for two columns in our data. In the order_total column, numbers are incorrectly stored as text due to the decimal separator being a comma. And in pay_terms, there are repeating and trailing spaces. As you can see, fixing these problems is both quick and simple:
Insights in the column profiler
To check if a particular column has insights, the first step is to select the column in the table. If there are any, we’ll see a lightbulb icon in the column information bar at the top of the workflow canvas:
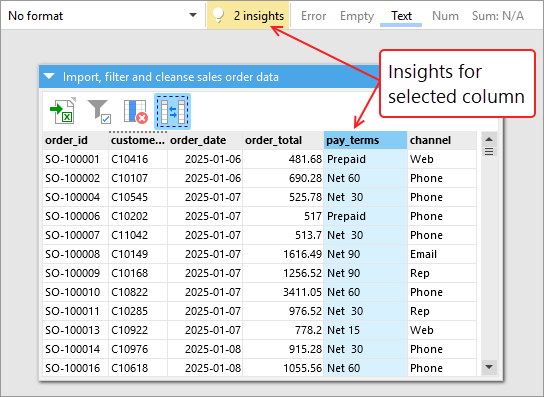
When we click on the Insights icon, the column profiler dialog opens up, showing the Insights tab with the available insights for the selected column.
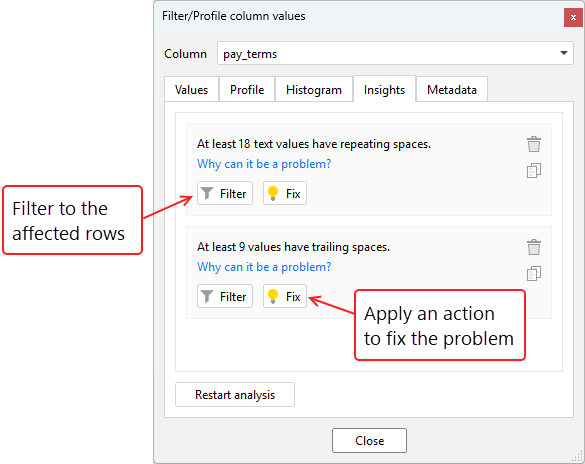
As with Insights in the Dataset Insights dialog, clicking on the Filter button of any suggestion will add an appropriate action to the table to filter the data to only the records where the problem exists. As we’ve seen before with “Dataset Insights“, clicking on the Fix button will add the relevant actions to resolve the issue.
Cleansing data with actions
EasyMorph has many actions which are specifically intended for cleansing data. These actions can be divided into two categories:
- Value cleansing - Those which cleanse individual values in the data without changing the number of rows or columns; and
- Row/column cleansing - Those actions that cleanse the structure of the table, by removing problematic rows or columns.
Cleansing actions can be found and added to our workflows in just the same way as any other action.
Actions which cleanse values
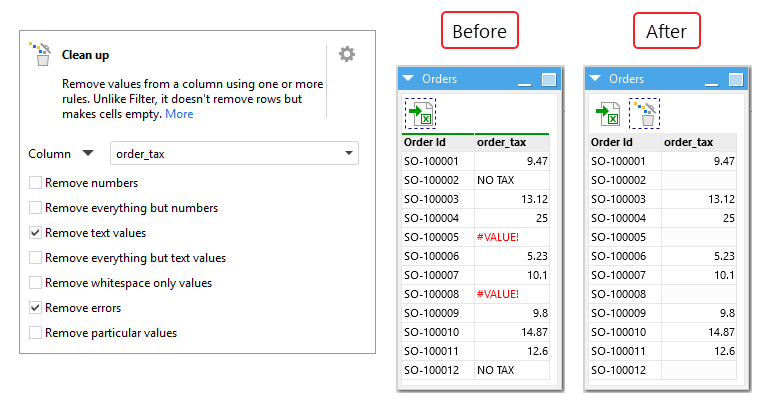
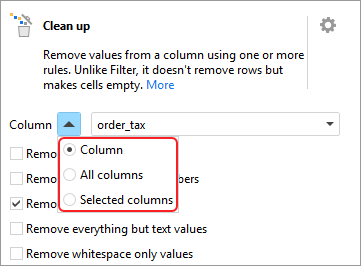
Multiple actions in EasyMorph cleanse table values either by removing specific characters or by replacing a cell value.
Cleaning text values
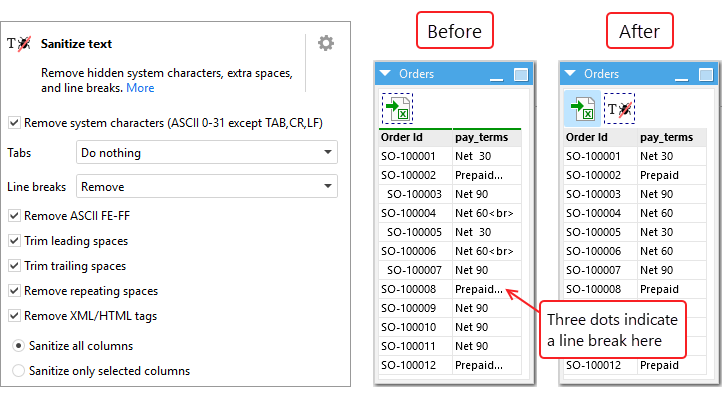
The Sanitize text action removes characters that are sometimes imperceivable but which can still cause problems. These include hidden system characters, leading / trailing / repeating spaces, tabs, line breaks, and HTML/XML tags. You can select which of these problematic characters to remove, and in which columns (or all of them), in a single action. In the following example, we are sanitizing multiple columns at once, removing leading spaces, line breaks and the HTML tag <br>:
Replacing values
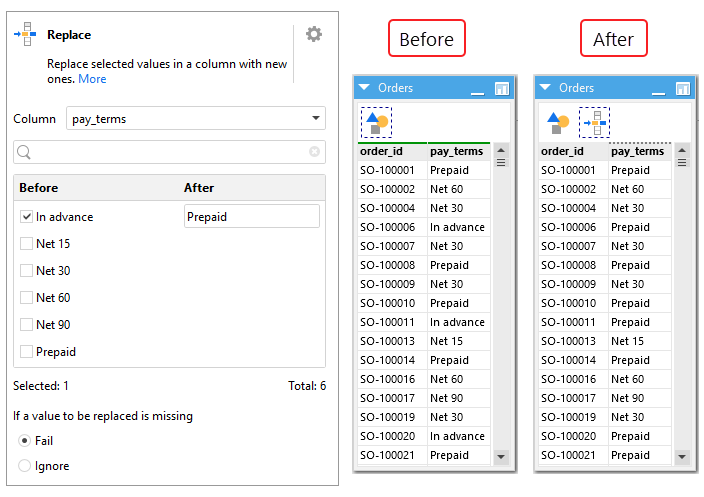
In some cases, we need to replace values in a certain column with other values in order to standardize our data. We can achieve this with the Replace action. In the following example, some of our orders have a payment term “In advance”, while others have “Prepaid”, when it means the same thing. All of these should be “Prepaid”, so we replace the incorrect values with this action:
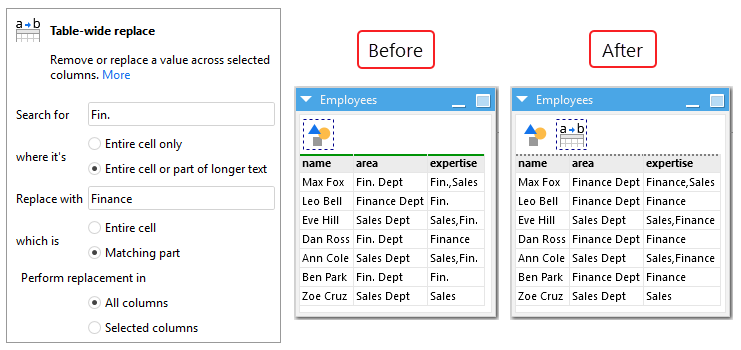
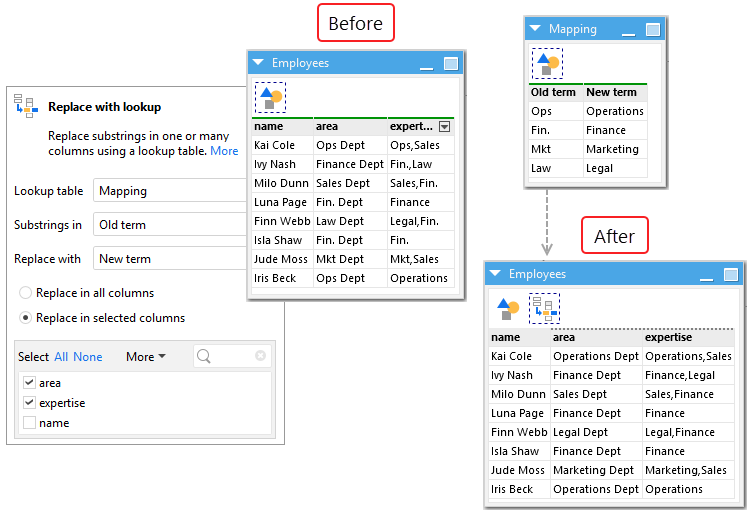
If you’re interested in advanced replacements, such as performing a table-wide replace (i.e. replacing a value across multiple columns) or replacing values based on a lookup table, find more information in the topics for power users section at the bottom of this tutorial.
Actions which remove rows or columns
Apart from fixing specific values, sometimes we find that whole rows or columns of a table need to be removed, either because they are duplicated or empty. We’ve called this structural cleansing, as applying these transformations change the dimensions of the table (rows x columns).
Removing duplicate rows
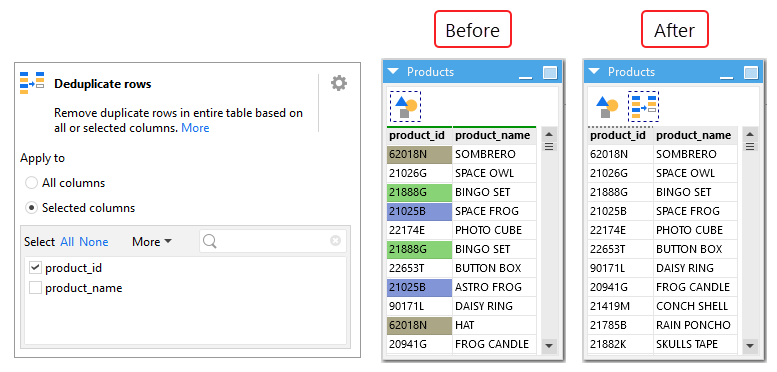
If there’s something where all us users that manipulate data agree on, is that we hate duplicates. They spoil our data and skew our analytics. The Deduplicate rows action in EasyMorph removes duplicate rows based on values in all columns or selected ones. In the following example, three product ids are duplicated (they have been color-coded in this screenshot for clarity). The “After” table only keeps the first occurrence of a duplicate product id.
Hint: If what you actually need is to keep duplicates, then the Keep duplicates action is for you.
Remove empty columns and rows
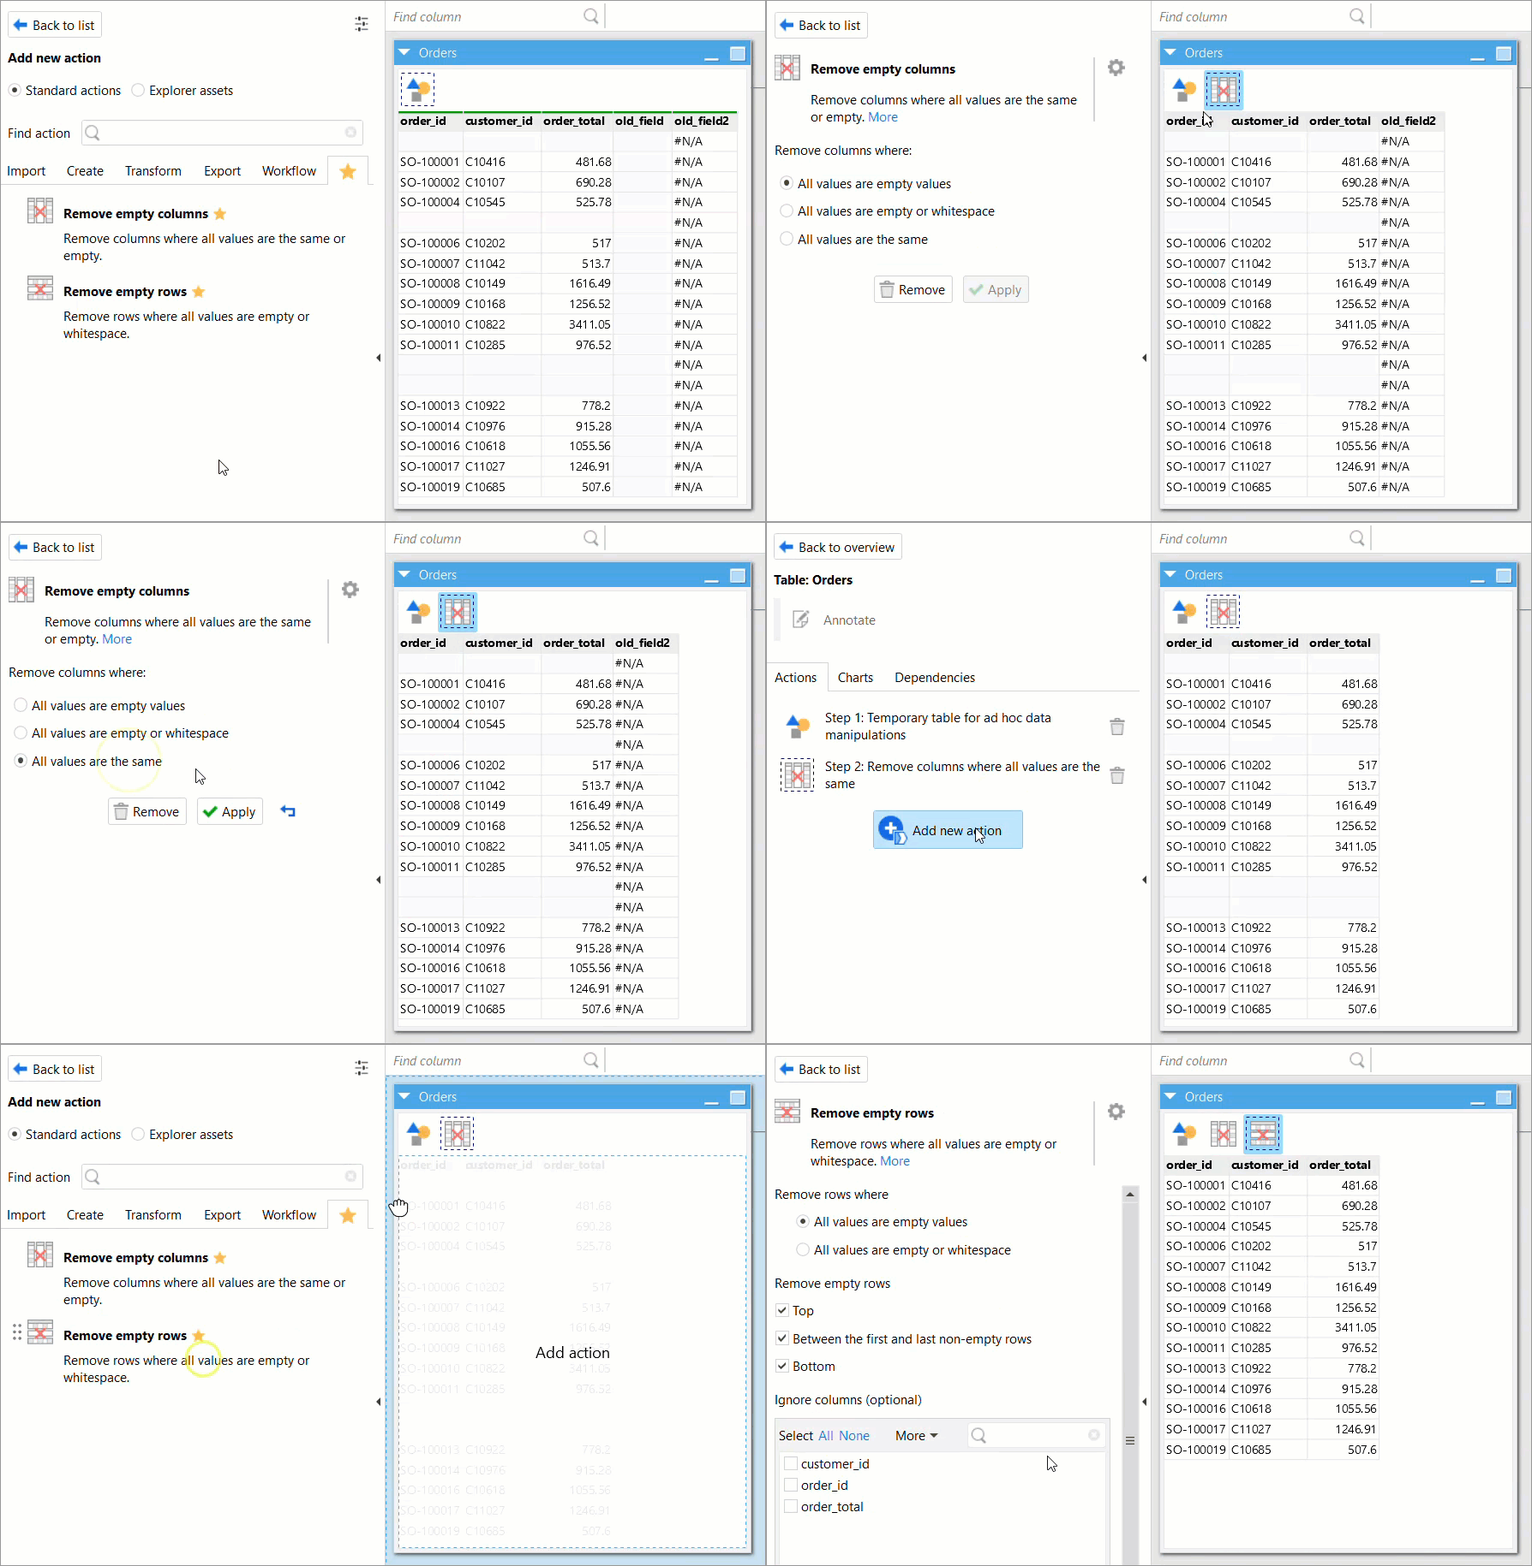
When we import data to EasyMorph, there may columns or rows that are all empty or whitespace, or columns where all values are the same. The Remove empty columns and Remove empty rows actions take care of deleting them.
In the following example, we first remove all columns that have the same value (in our case, either empty or “#N/A”), and afterwards we remove all empty rows, leaving only the relevant data:
Trim unnecessary rows
In some cases, we may import data into EasyMorph with rows that are not empty but still need to be removed, like an Excel spreadsheet with a totals row at the bottom. In the example below, the sales and margin columns have a row with totals. However, we may sometimes receive the data without the totals, so we don’t always need to trim the last row. Here is where the Trim table by condition action is very useful:
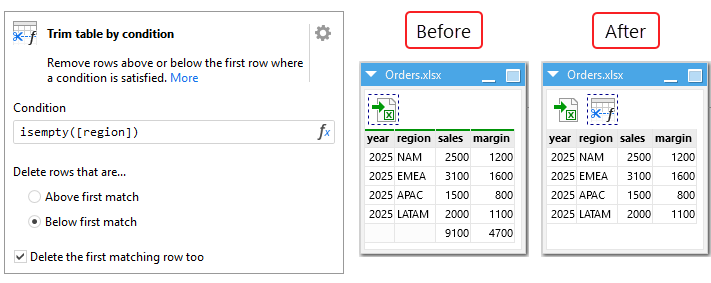
We’re checking if the region column is empty using the isempty([region]) condition. When the condition is satisfied in a certain row, that row along with any below it will be trimmed. Note that in this case it is necessary to check the option Delete the first matching row too.