When building and editing workflows in EasyMorph, it is common to switch back and forth between preparing data and analysing data. One of the main tools available to analyse data is the Analysis View.
The Analysis View is a dedicated workspace for focusing on a single table of a workflow to perform deep data exploration, profiling, and interactive filtering without altering the core workflow.
Analysis View provides the following key capabilities:
- Instant filtering - Filter data dynamically without adding permanent filtering steps to your data preparation logic.
- Visual analysis - Build simple drag-and-drop charts and pivot tables directly from the active dataset.
- Technical data profiling - Analyse and filter data based on data types and find potential data quality problems using Facets.
Opening and navigating in Analysis View
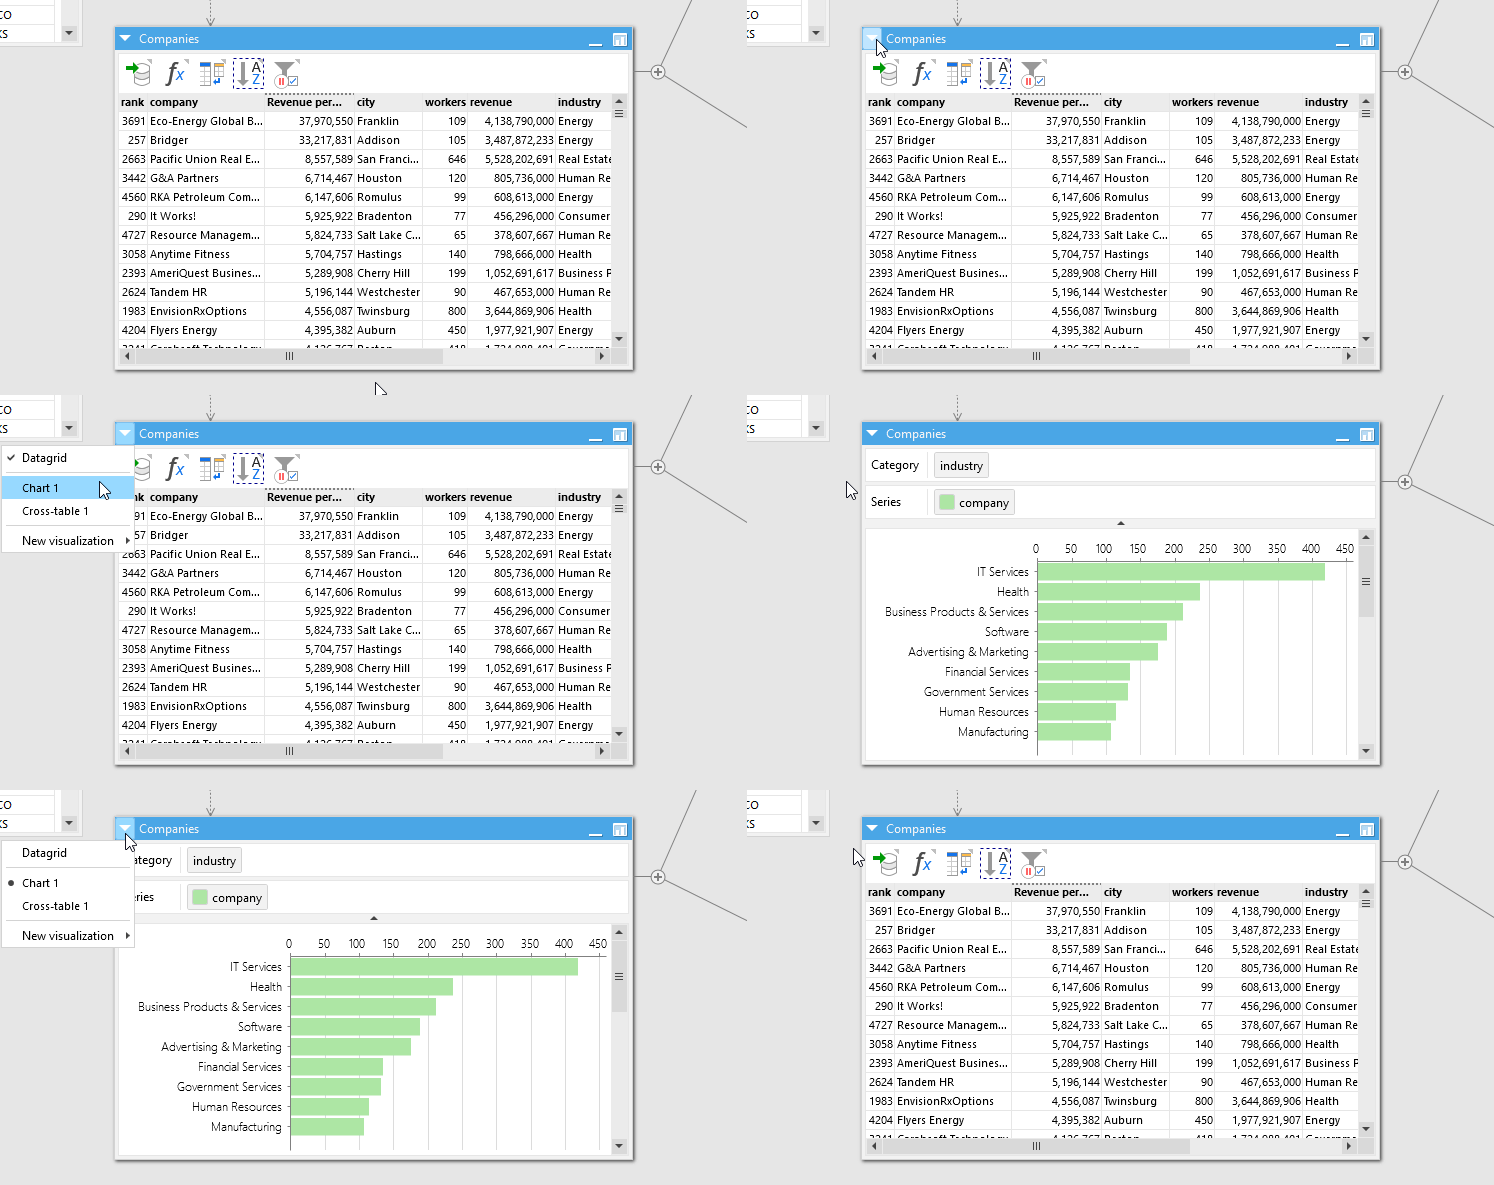
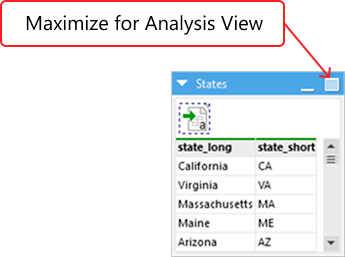
The simplest way to enter Analysis View for a table is to either double-click the table’s header, or click on the maximize icon in the top right of the table’s header bar.
You can also open Analysis View by right-clicking on any action in the table’s action chain and selecting “Action’s result” → “Analyse”.
The Analysis View window comprises 3 main sections:
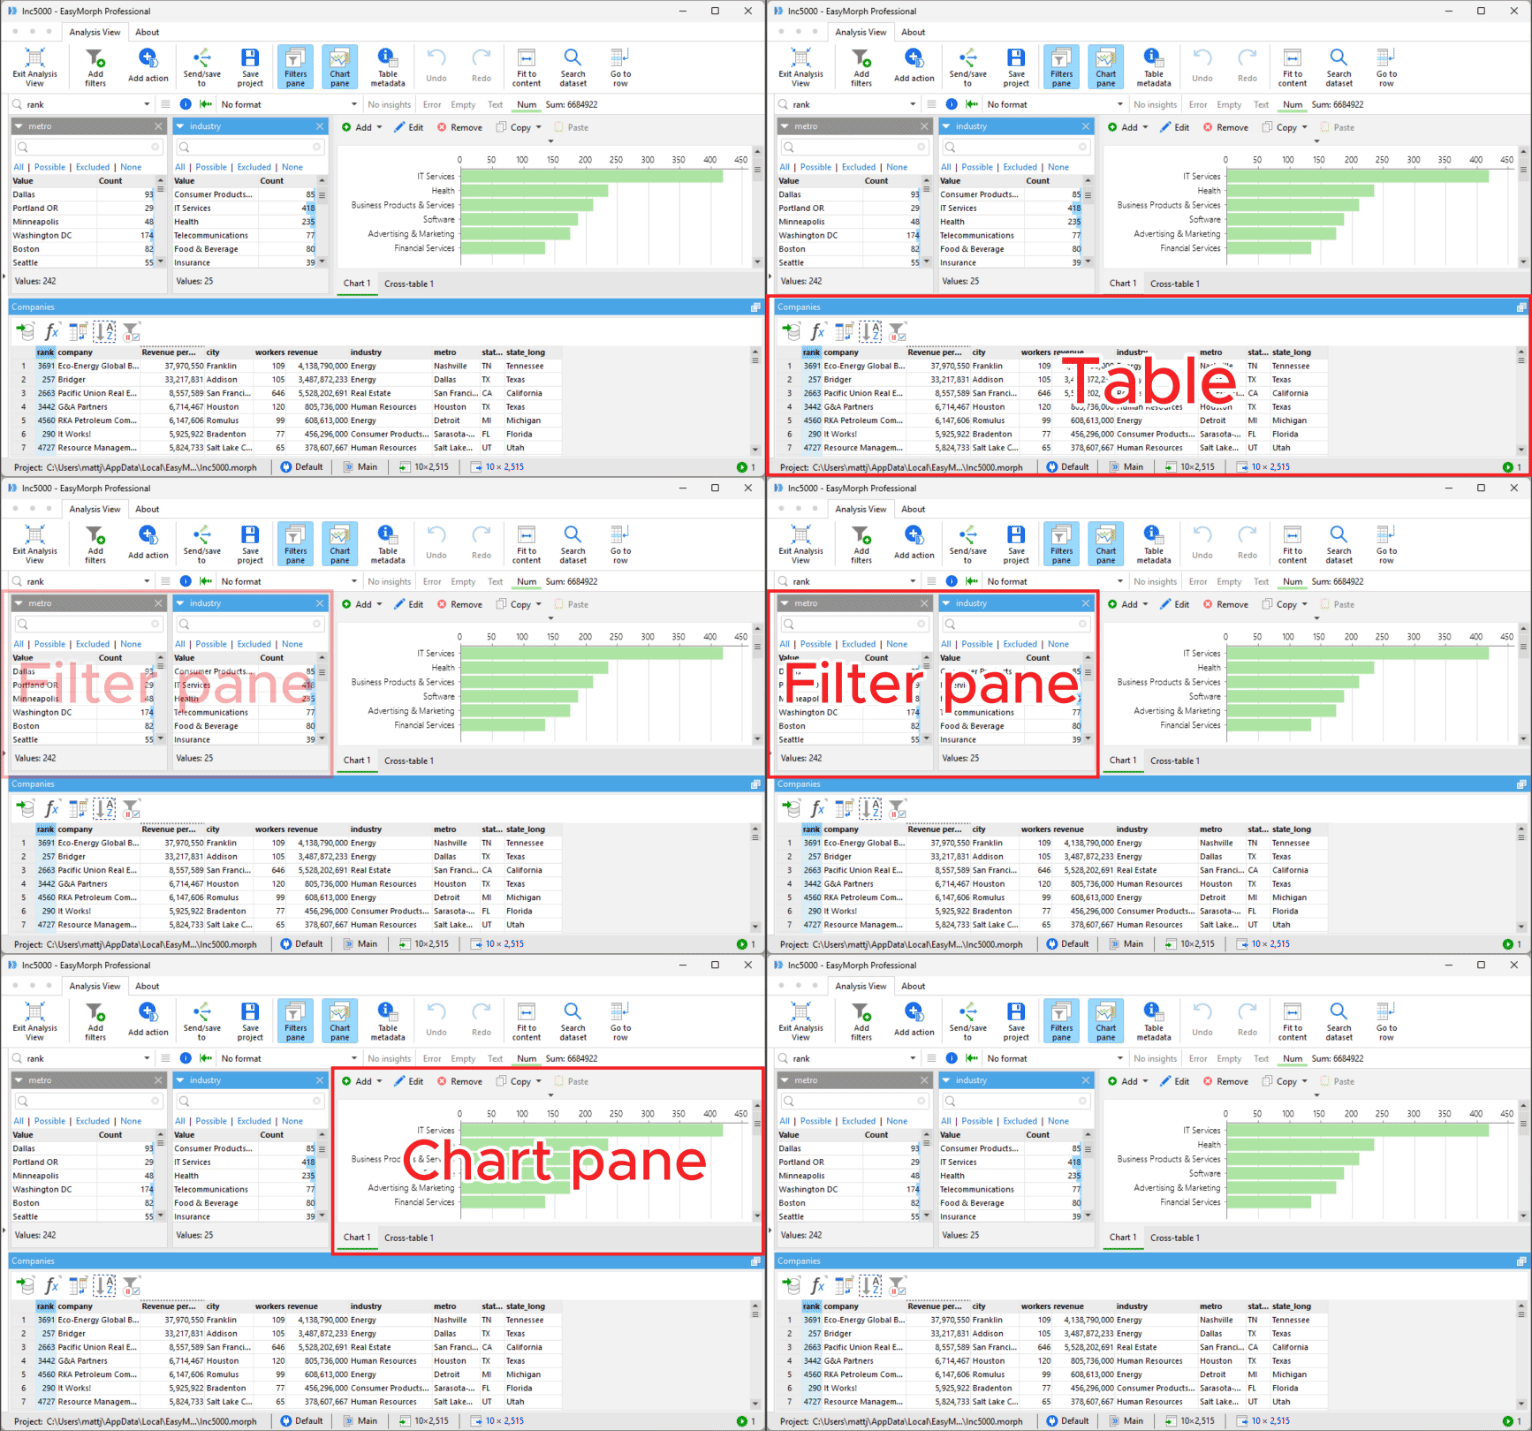
At the bottom is the table which includes the action chain and the datagrid. Just like when working in the workflow editor, we can click on any action in the table’s action chain and the data grid will show the data as it is at that step.
The top left of the Analysis View contains the filters pane. Here we can add fields from the table as Instant Filters.
The top right of the Analysis View window contains the chart pane. Here we can create and view charts and data visualizations to help us to understand, validate and profile the data.
Warning: If you aren't able to see the filter pane and/or charts pane then they are likely hidden. You can show and hide them using the relevant buttons on the navigation bar.

We can exit and reopen Analysis View at any time and EasyMorph will remember the Instant Filters and charts we added. The Analysis View is also saved to the EasyMorph project file (.morph) so that if we reopen the project at a later date, the Analysis View will still be as we left it.
Instant Filters
The Analysis View allows us to apply what we call Instant Filters. We refer to them this way because they allow us to filter the data and see the effect instantly, without the need to add one of the filter actions to the table’s action chain.
When we first open Analysis View, the filter pane will be empty with no Instant Filters yet created.
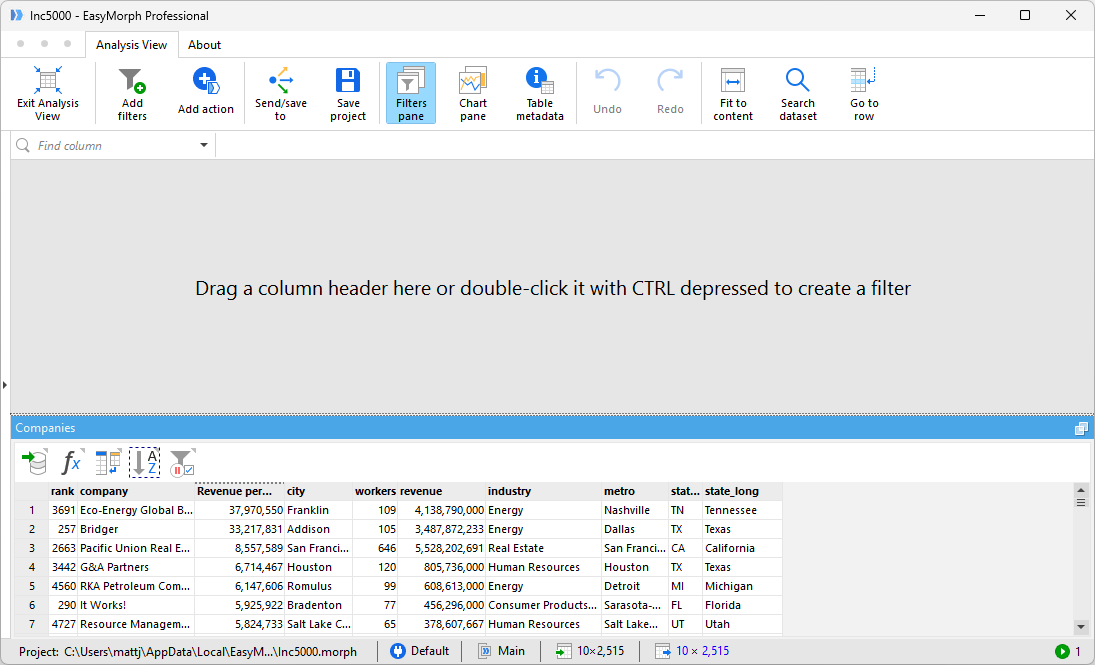
Warning: If you aren’t able to see the empty filter pane, enable it using the Filter pane button on the navigation bar, as described above.
Adding and removing Instant Filters
The easiest way to create Instant Filters is to drag-and drop a column’s title from the table’s datagrid to the filter pane.
Hint: There is also an Add filter button on the navigation bar which you can use instead.

If you wish to remove an Instant Filter, simply click on the cross icon in the top right of the filters header.
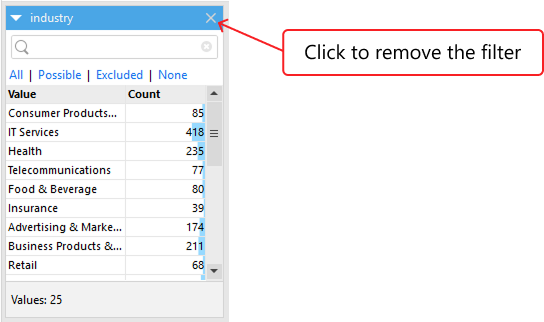
Filters can be reordered within the filter pane by dragging-and-dropping them by their header bars into the desired order. They can also be resized as needed.
Using Instant Filters
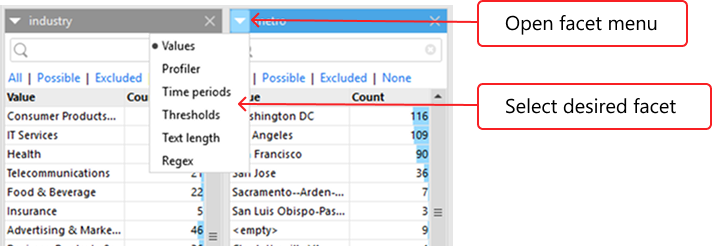
Once you’ve added one or more Instant Filters to the filter pane you can begin using them to filter the data. Each filter in the filter pane displays two columns. The first is the Values column which contains a list of the distinct (A.K.A. deduplicated) values the data column contains. Next to it is the Count column which tells us how many times each value occurs in the data. Additionally, the background of the Count column displays a light blue bar indicating the percentage of the total records the count represents.
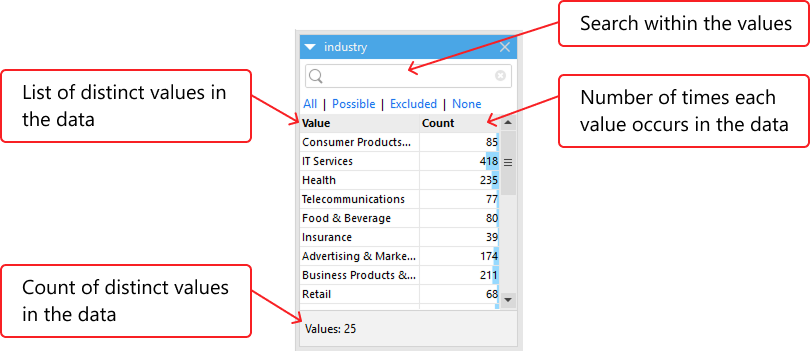
At the top of each Instant Filter is a search bar which can be useful for finding specific values within a long list. And at the bottom of the filter we see the number of distinct values in the field.
When we select one or more value in the filter they turn blue to indicate they are selected. To apply the selection, simply click on the Apply button at the bottom of the filter. We can change the filter by selecting additional values and/or deselecting values and again clicking on apply. When we apply the filter, the table view will update immediately to show only data which is relevant for our filter.
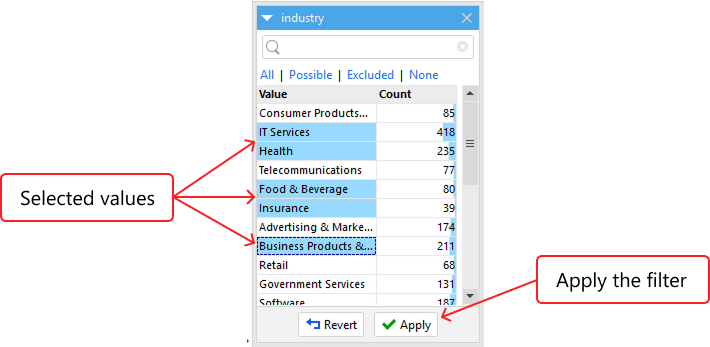
If you change your mind before applying the filter, you can click on the Revert button to revert to your previous selections within the filter (if any).
Hint: It is also possible to select all values which appear sequentially between two points in the filter’s value list. To do this, select the first value, then hold the Shift key and select another. All values between these two will be selected.
When we apply an Instant Filter, the selected values move to the top of the values list and the number of selected values is displayed at the bottom of the filter.
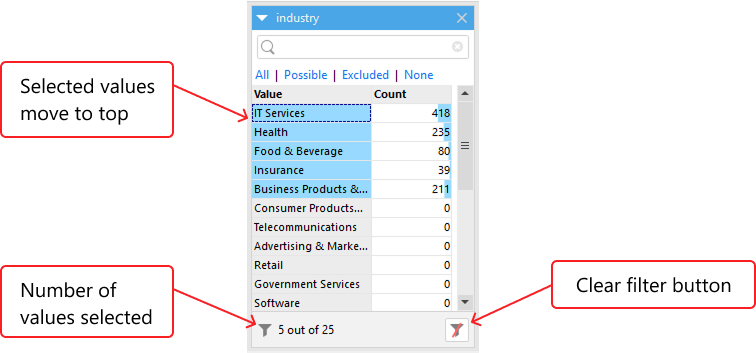
To clear the applied filter, click on the clear filter button displayed at the bottom right of the filter.
Hint: By default, the values shown in the Instant Filter are displayed sorted by data type and alphanumerically. Blank or empty values appear at the top, followed by text values, and finally numeric values. You can sort the values by either the Value or Count columns by clicking on their headers within the filter. Clicking the same column repeatedly will cycle between ascending and descending sort order. This can be especially useful when you wish to select the top or bottom X values.
One of the most important features of Instant Filters is that they remain in place when we switch between different actions in the table’s action chain. This allows us to quickly see how the filtered rows are affected by the different actions as the data passes between them. For example, if we identify a potential problem in the data, we can click back through the actions one-by-one, seeing how the data changes and what may be causing the problem.
The blue, white and grey rule
As we’ve seen above, when we select values in an Instant Filter and apply them, they are highlighted in blue to indicated the data is being filtered by them. All other values in the same filter are highlighted in grey to indicate they are excluded from the data because of the filter.
You may also have noticed that when we apply a selection in one Instant Filter, all values in other filters are also highlighted grey or white. We often refer to this highlighting as the blue, white and grey rule which works as follows:
- All values we select and filter on are highlighted in blue.
- Values which are possible based on our existing filters are highlighted in white. These values are considered possible because they exist in the data in one or more rows alongside the values which are being filtered by.
- Values which are excluded (i.e. NOT possible) based on our existing filters are highlighted in grey. These values are considered excluded because they do NOT exist in the data in any rows alongside the values which are being filtered by.
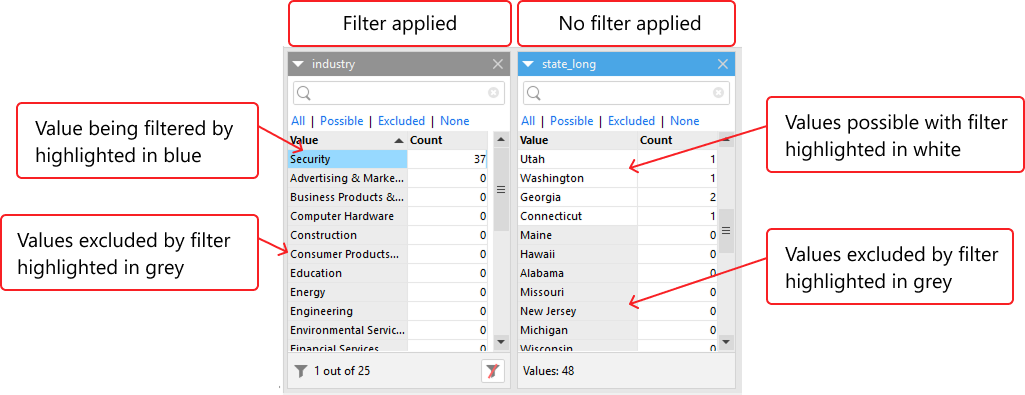
This highlighting can alone provide valuable insights into the data. For example, in the above image, we can immediately see that we must have customers in the security industry located in Utah, Washington, Georgia, and Connecticut because they are highlighted white. And we must not have customers in the security industry in Maine, Hawaii, Alabama, etc.
At the top of each filter are 4 quick selection links. When clicked they quickly select values based on the blue, white, and grey rule as follows:
- All - Selects all values in the column.
- Possible - Selects all values in the column which are possible based upon filters already applied (see The blue, white, and grey rule below).
- Excluded - Selects all values in the column which are not possible based upon filters already applied (see The blue, white, and grey rule below).
- None - Deselects all values in the field.
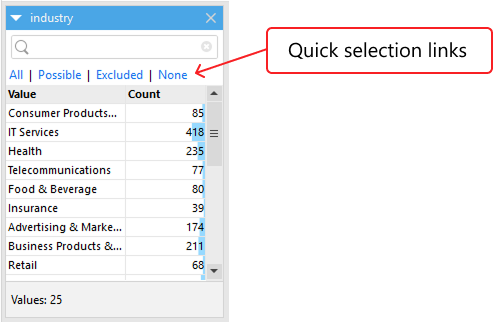
Hint: You can use the Excluded quick selection link to quickly invert your selection in the column (i.e. select all of the values which aren’t currently selected and deselect those which are). This can be useful when you wish to select all but a few values, by first selecting those which you don’t want to be selected and then clicking on the excluded quick selection link to invert the selection.
Making an Instant Filter permanent
Sometimes whilst exploring and analysing data in Analysis View we find a filter which we’d like to apply permanently to our data by adding the relevant filter action to our table’s action chain. As mentioned earlier, we can of course do this whilst still in Analysis View by clicking on the Add action button on the menu bar, finding the relevant filter action, dragging-and-dropping it into our table’s action chain, and configuring it as needed. There is however a quicker way.
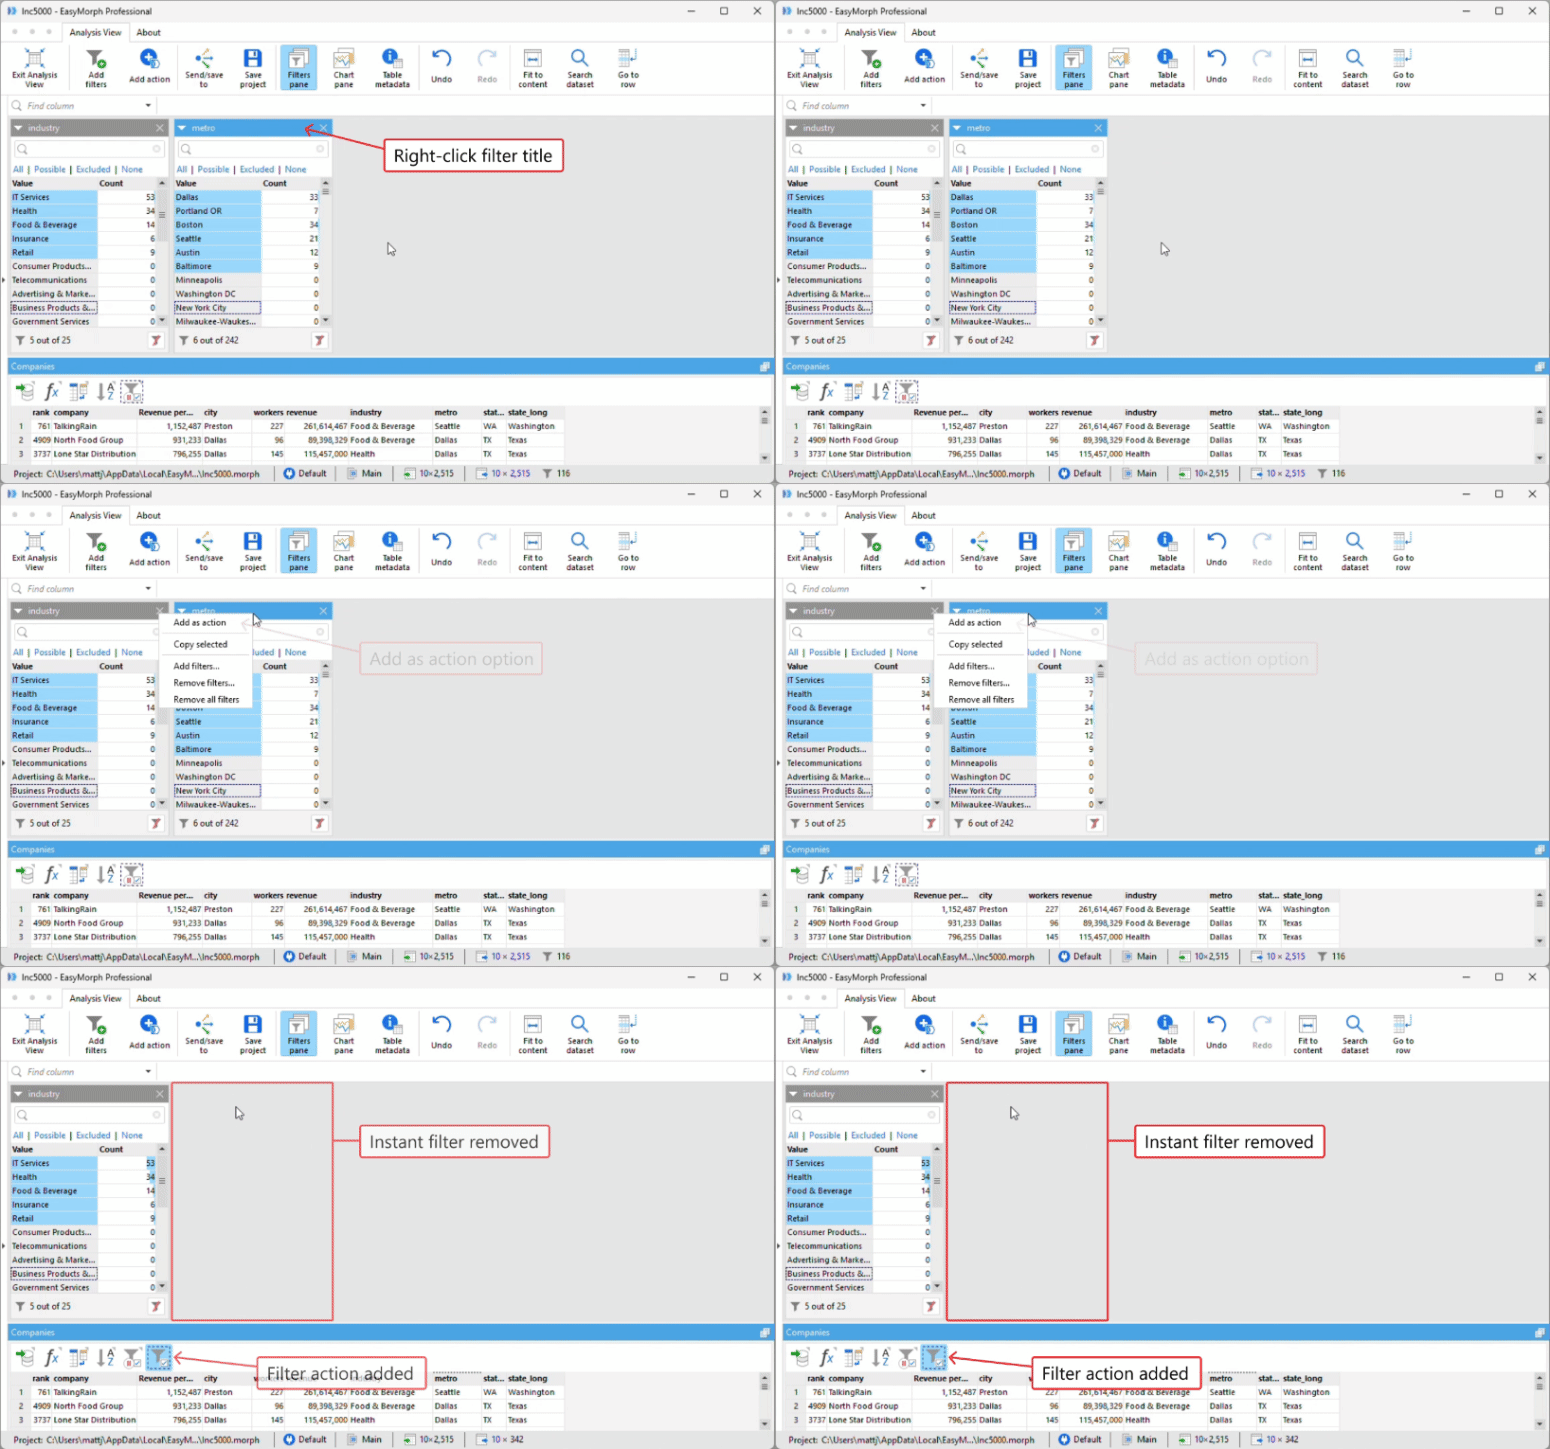
If we right-click the title of an Instant Filter which has a filterselection applied, we see an option to Add as action. When we click this, EasyMorph will convert the Instant Filter to the relevant filter action, configuring it for us to match the Instant Filter.
Warning: When converting an Instant Filter to an action in this way, the Instant Filter is removed from the filters pane. This is expected behavior.
Hint: Rather than going in and out of Analysis View to make changes to a table’s actions, you can add, remove, configure and reorder actions directly in Analysis View in exactly the same way as you would in the main workflow editor.

On the top menu bar you’ll find the same Add data button found in the main workflow editor. Clicking it opens the left-hand settings panel. You can use it to find and add actions to the table’s action chain.
The settings panel can also be collapsed and expanded as needed to change settings for existing actions.
Charts and data visualizations
As well as applying Instant Filters, we can also create simple charts and data visualizations in the Analysis View to help us to better understand and analyse our data.
Warning: If you are unable to see the charts pane, enable it using the Charts pane button on the navigation bar as described earlier in this tutorial article.

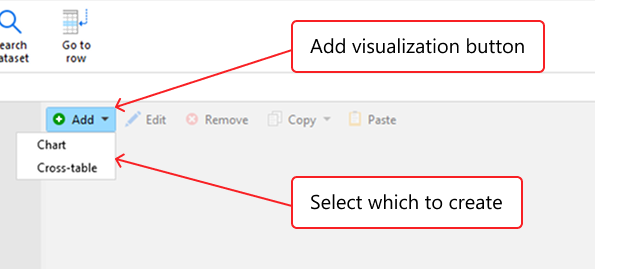
To add a visualization, click on the Add button at the top left of the charts panel. A menu will appear for us to select if we wish to create a new Chart or Cross-table.
Charts
When we create a new chart, the charts pane changes to allow us to define the chart we require. The simplest chart is defined from 2 columns within the data as follows:
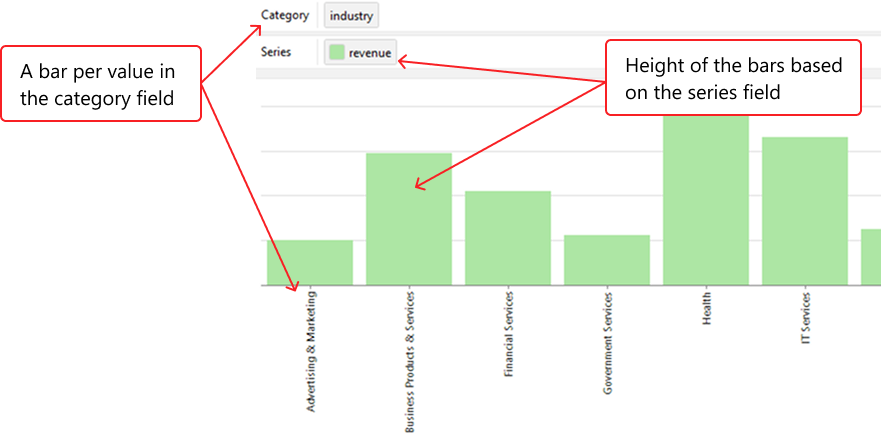
- The Category - The field in the data which should be used to group the data by when calculating the chart. For example, in a bar chart, if we use the industry column as our category, we will have bar for each industry.
- The Series - The field to which an aggregated calculation will be performed (i.e. sum, count, etc). In a bar chart, if we use the revenue field for the series and set the aggregation to sum, then the height of each bar will be based on the sum of the revenue for each category.
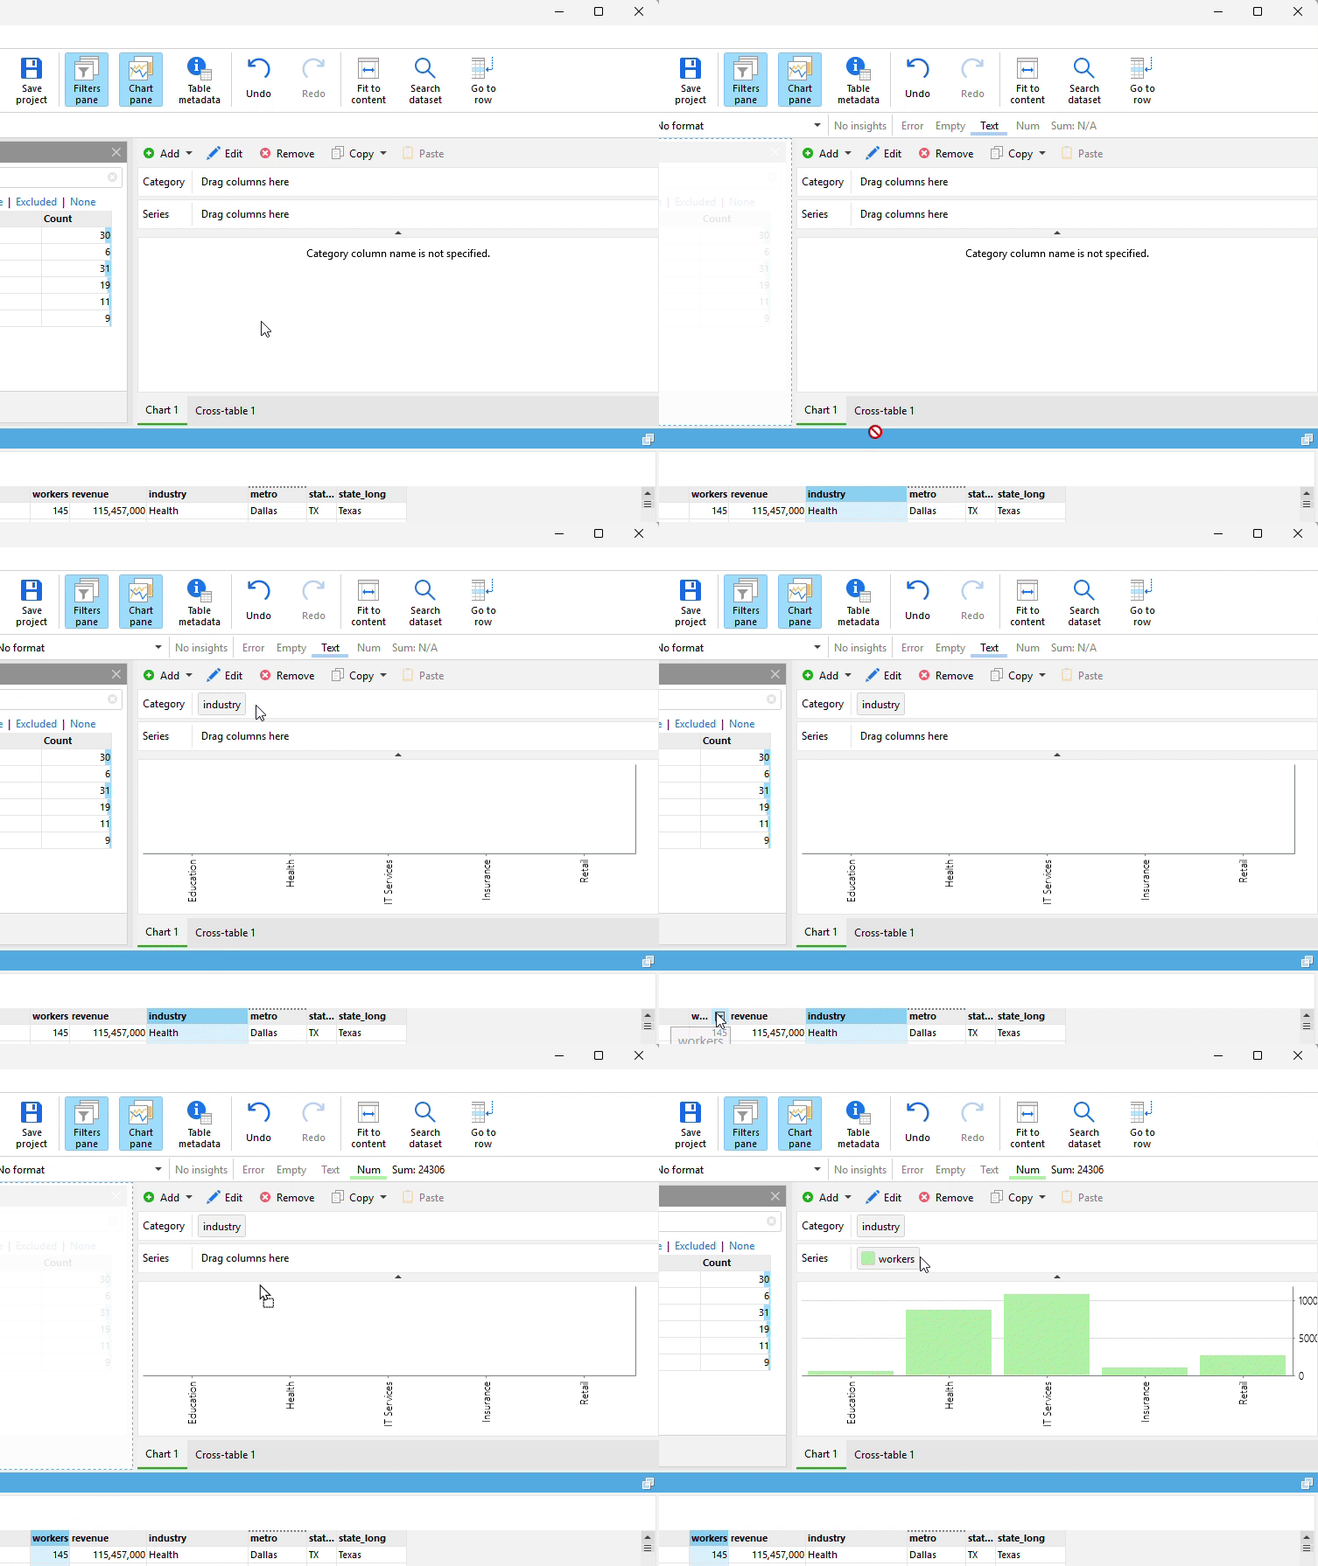
To add a field as the category or series of a chart, we simply drag-and-drop them from the table into the relevant position in the chart pane.
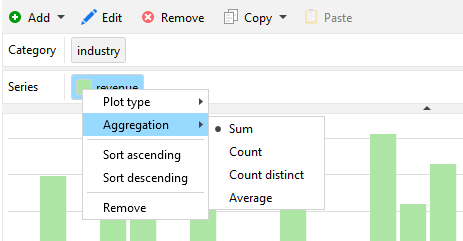
By default, EasyMorph will perform a sum aggregation for the series. We can change this by right-clicking on the series and selection “Aggregation” then the aggregation we’d like to apply.
We can also change the aggregation and many other chart settings by clicking on Edit at the top of the chart pane, which opens the Cart properties dialog.
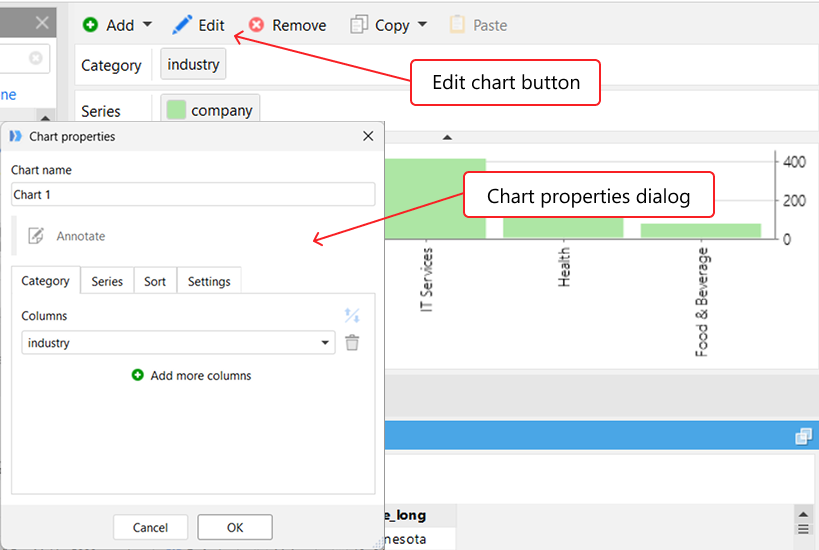
At the top of the chart properties dialog we can change the name of the chart. This name appears at the bottom of the Analysis View chart pane as a tab. We can use these tabs to switch between different charts we create. The dialog also has 4 tabs:
The Category tab unsurprisingly contains all of the settings for the chart’s category. You can remove, edit or even add additional category fields to the chart.
Tip: When a chart has two or more category fields, you can quickly switch between them whilst viewing the chart in Analysis View. To switch the category, click on the black arrow on the right of the category name and select the category you wish to switch to.
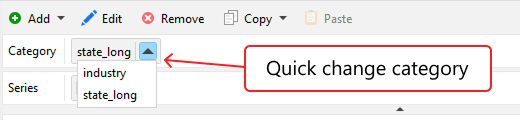
You can also add additional categories by simply dragging more columns from the Analysis View table to the category section at the top of the chart.
As you might expect, the Series tab contains all of the settings for the chart’s series. It shows us the existing series, which we an click to change its configuration.
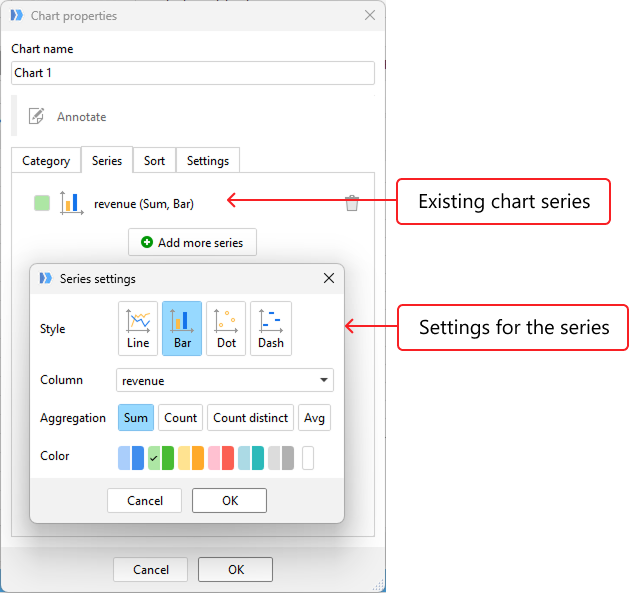
It is possible to add multiple series to a single chart. These different series can have different styles, allowing us to mix bars, lines, dots and dashed in the same chart.
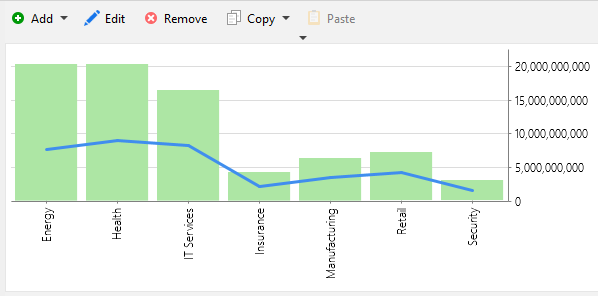
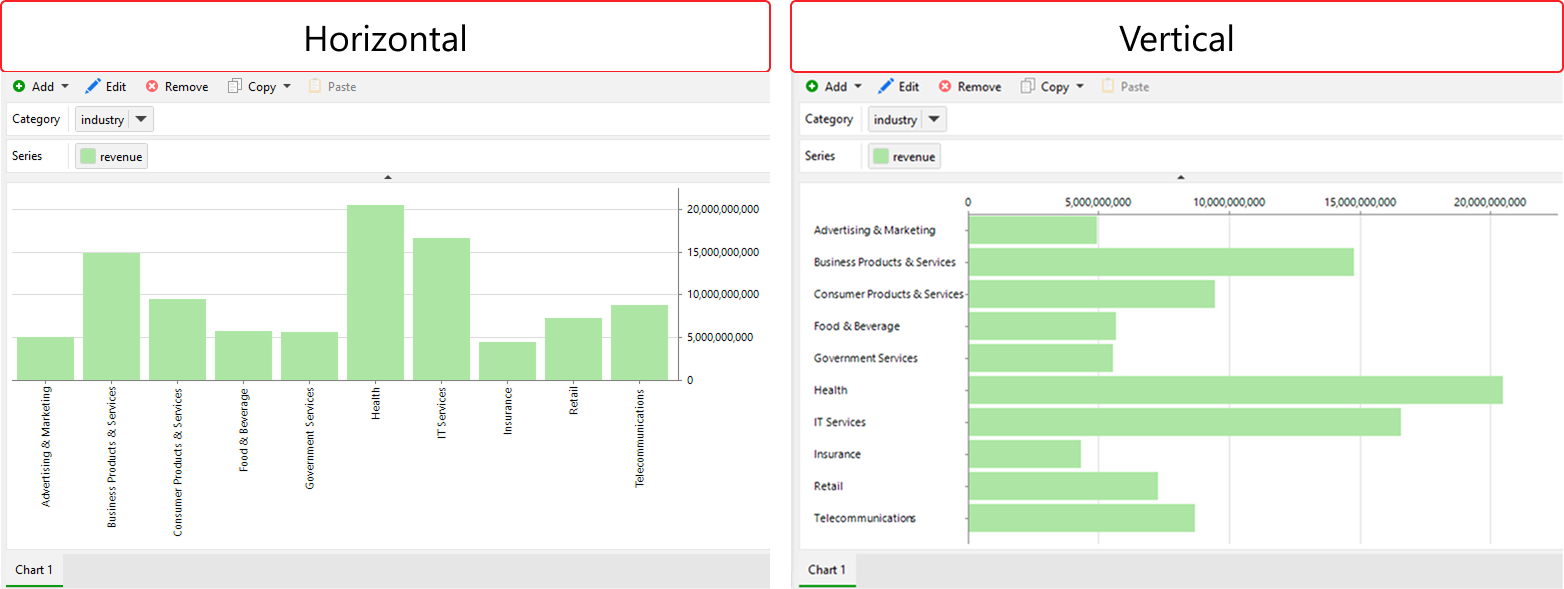
The Sort tab allows us to sort the category values in various ways depending on our needs. And lastly, the Settings tab includes other settings which define how the chart should be formatted. The most notable is the option to change the chart’s display style between Horizontal and Vertical.
Cross-tables
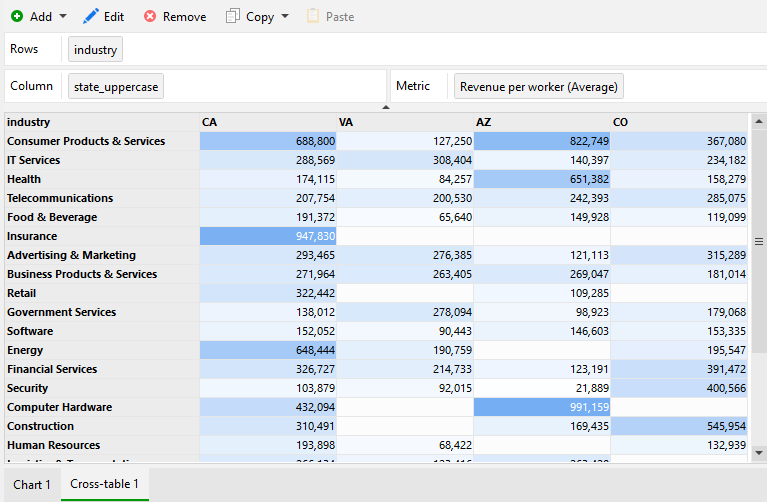
A cross-table in Analysis View allows us to visualize data in an aggregated tabular form. They are sometimes called pivot tables because of similarities with pivot tables in other tools such as Excel.
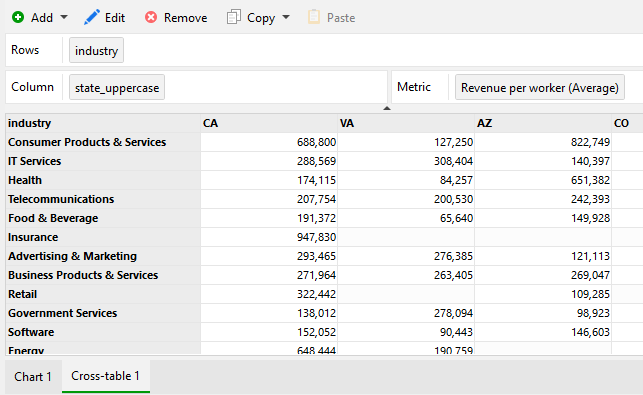
A cross-table is comprised of three columns from the data:
- The Row - The field to use as the rows of the cross-table. A row will exist for each distinct value in the chosen field.
- The Column - The field to us for the columns of the cross-table. A column will exist for each distinct value in the chosen field.
- The Metric - The field to which an aggregated calculation will be performed (i.e. sum, count, min, max, etc). A number will be calculated for each combination of row and column.
We can add columns from the data table to the cross-table in the same way as when building a chart, by simply dragging-and-dropping them.
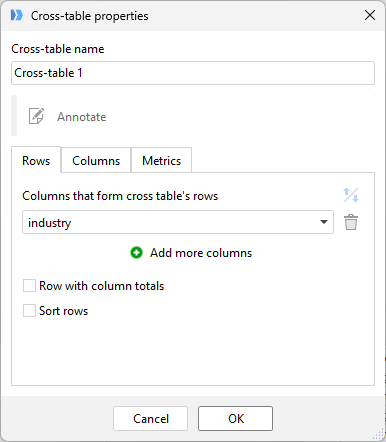
Much like for charts, we can edit the cross-table using the Edit button at the top of the chart pane. When clicked, the Cross-table properties dialog opens allowing us to add or edit the fields used for the rows, columns and metrics; their sort order; and whether totals rows and columns should be displayed.
One important setting to note is on the Metrics tab where it is possible to define a Background gradient for the metric.
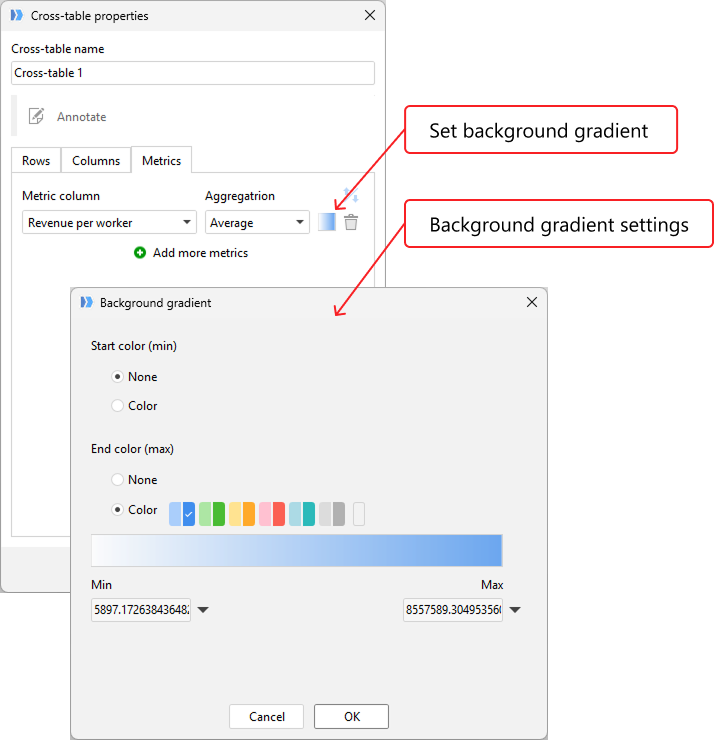
This gradient is then used to highlight the individual cells in the cross-table depending upon their value.
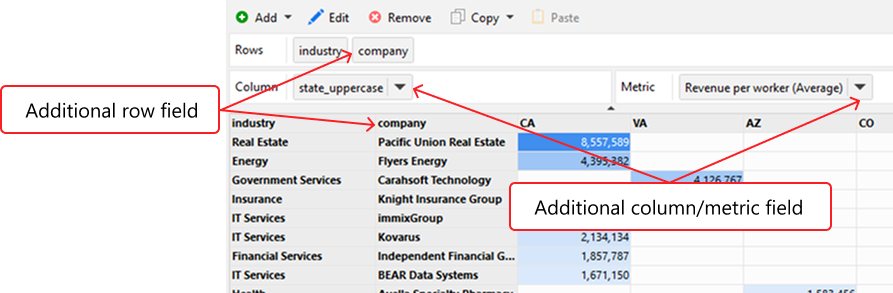
As with charts, it is possible to add more then one row, column and metric to a cross-table. When we add addition rows, the cross-table displays a row for each distinct combination of the values in the fields specified. When we add more than one column or metric, EasyMorph allows us to quickly change between them whilst viewing the visualization in Analysis View.
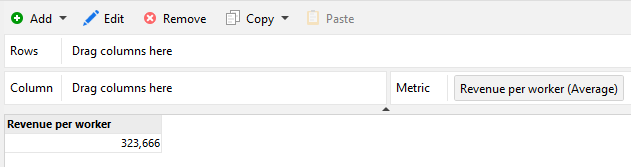
Note: It is possible to build a cross-table with just a single metric with no column or row. Doing so results in a single aggregated metric for the entire dataset.
Saving and sending data
As we filter, analyse and explore the data in Analysis View, we sometimes wish to save the data or a visualization to use outside EasyMorph. For example, if we discover a data quality problem, we may wish to save the offending rows as an Excel spreadsheet or CSV file to be able to email to a colleague to assist in resolving the issue.
Saving the data table
On the navigation bar at the top of the Analysis View is a Save/send to button.

When we click this button, a dialog opens with many options for saving and sending the data. First, we must specify whether we wish to save or send the full dataset or the filtered dataset (those records which are possible based on the applied Instant Filters).
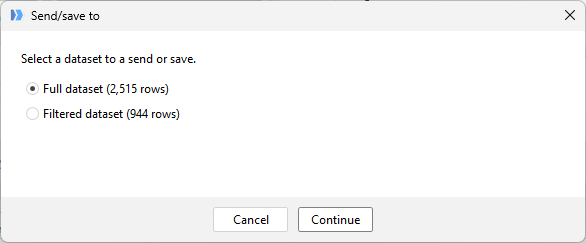
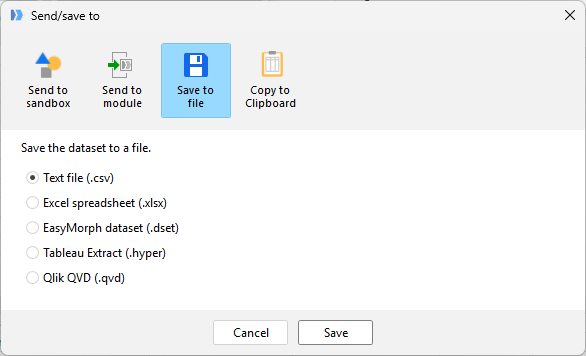
When we click on Continue we can chose to where we would like to send or save the data. The four options are as follows:
- Send to sandbox - Send the data to a sandbox table in our EasyMorph workflow.
- Send to module - Send the data to a module of our workflow.
- Send to file - Save the data to a text file (
.csv), an Excel spreadsheet (.xlsx), an EasyMorph dataset (.dset), a Tableau hyper file (.hyper) or a Qlik QVD file (.qvd). - Copy to clipboard - Copy the data to the Windows clipboard so you can paste it into another application.
When we save the data to an EasyMorph dataset file, the Analysis View is also saved to the file. If we open the .dset file in either EasyMorph Desktop, EasyMorph Hub or CSViewer we can see the Analysis View as it was when the file was exported. This is also true when using the Export dataset action in the table’s action chain.
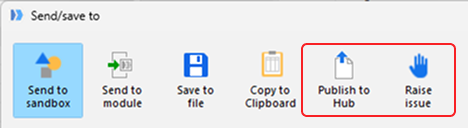
Note: If we link EasyMorph Desktop to an EasyMorph Hub, we see additional options for sending the dataset to the Hub.
Copying a visualization
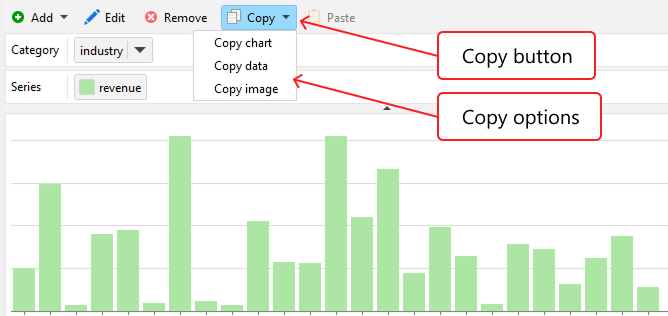
We can copy both chart and cross-table visualizations in Analysis View for use in Excel, presentations, emails and any other tool. To copy a visualization, click on the Copy button at the top of the chart pane. Depending on the type of visualization, we can copy the visualization in different ways. For example, a chart can be copied as:
- Copy chart - Copy the chart definition. It can then be pasted into a different table’s Analysis View.
- Copy data - Copies the tabular data behind the chart (the categories and series calculations).
- Copy image - Copies the chart as an image for pasting into an email, document, presentation or other tool.