Merging data is something almost every analyst does regularly. Whether you are combining monthly spreadsheets, enriching a report with lookup values, joining database tables, or matching customer records with slightly different names, merging is a core part of data work.
Unfortunately, it’s also one of the simplest ways for silent errors to creep into an analysis process. A merge will appear to be successful, yet be riddled with errors. By the time those issues reach a dashboard, report, or business system, they may have already influenced a decision.
That’s why it’s important to understand how merges work and what’s the best way to avoid issues. Throughout this article we’ll offer some practical advice to avoid errors and use merges for almost any scenario.
Why Data Merging is Important
Business data is rarely stored in one tidy, central repository. Your team probably uses various combinations of spreadsheets, CSV files, databases, cloud-based applications, finance systems, CRM programs, APIs, and archived reports to manage its operations.
In order to get a comprehensive picture of the business, analysts need to tie all that data together. Data merging supports many day-to-day activities including:
- Combining monthly sales files into a yearly report.
- Adding customer names or product descriptions to transaction data.
- Connecting current database records with historical archives.
- Matching invoices to financial periods.
- Combining regional reports into a global view.
- Checking whether values exist in another data source.
- And many more.
The problem with tying data together is that data sources are typically inconsistent. One column may be named differently; a key field may include blank spaces; a lookup table may be missing values; or there may be duplicate values in areas where no duplicates should exist.
Tip: If you’re having problems with merging data, you can watch our webinar recording about performing merges by following along with our team.
An improper merge can create duplicate records, eliminate good data, pass bad information into reports and downstream applications and cause many other issues. Because the resulting data after a merge may initially seem correct, these problems may be very difficult to identify without examining both the input data and the merged data. Below are a few ways analysts can merge data and how to avoid errors for each.
1. Appending/Concatenation of Data
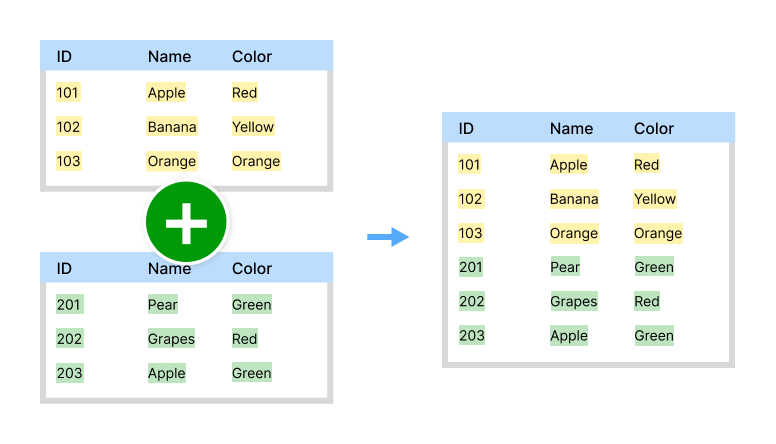
Appending data takes two or more tables which are normally identical and combines them into one table. This is one of the most common methods used for merging data.
When to Append Data
- Combining multiple monthly spreadsheets or CSV files into a single dataset.
- Consolidating regional reports into a global report.
- Combining a live database table with an archived database table.
- Joining multiple datasets that have the exact same structure.
Example: An analyst receives a separate sales spreadsheet for each month and appends all twelve into a yearly sales table.
What Can Go Wrong
One major assumption when using append is that all the inputs have exactly the same structure. However, if one file has a column in a different order, a renamed header, an additional column, or a missing column, the data will become dis-aligned.
For example, "revenue" column in one file could be incorrectly listed as "cost" in another file, which would cause a completed-looking report that actually includes erroneous values.
How to Avoid Errors prior to appending data:
- Verify that all input files use the exact same headers and data types.
- Compare the amount and order of columns.
- Look for any unknown, new, or missing fields.
- Rename any column headers before appending data.
- Review row counts from each input file.
- Verify that the total row count in the combined file matches the sum of the row counts from each individual input file.
Additionally, adding a column identifying the source file will allow you to track back each row in the combined file to the original spreadsheet, report or database table.
See it in action: appending multiple spreadsheets and fixing merge errors
2. Lookups
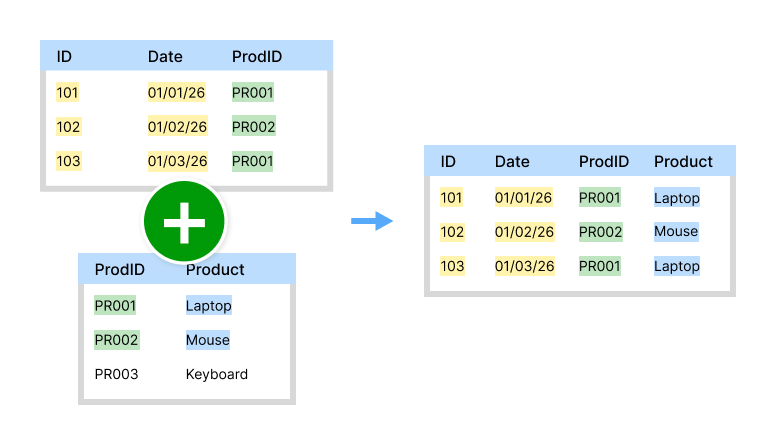
Lookups allow you to locate a value within a different table and then bring back the associated values (data) from that table. The way a lookup works is similar to how VLOOKUP or XLOOKUP works in Microsoft Excel.
An example of this would be an item purchase database that includes product IDs. Then there could be a separate "lookup" table that lists the product IDs as well as their respective product names, categories, and prices.When to use them
You want to perform a lookup whenever you want to convert codes or IDs into readable descriptions, obtain additional information, verify the existence of a value in a separate table, map old values to new standardized values, or categorize items based upon a reference table.
Tip: Lookups only allow you to bring back a single additional field. If you need to bring back more than one field, you can use a left join as described below.
Possible problems with Lookups
One of the most common problems people have with lookups is that they receive missing values. An example of this is when there are purchase records for products that do not exist in the corresponding table. In these cases, the lookup will return blank results. If these blank results were not reviewed prior to reporting, reports could contain missing categories, unknown products, etc... Along with partial customer details.
Another problem is having duplicate values in your lookup table. A lookup always returns the first match found. Therefore, if there are duplicate values in the lookup table, it may not return the correct one.
Solutions to avoid errors with Lookups
- Check for blanks and duplicates in your lookup key. If your data contains duplicate values and/or blanks, it will cause unpredictable results.
- Identify all unmatched records after your lookup.
- Review your blank results before exporting.
- Standardize formats between both tables prior to matching.
- Verify that your lookup table is current and complete.
- Create validation rules for unexpected missing matches.
A reliable workflow should allow you to easily locate any unmatched records and determine whether the problem was a missing reference value, format differences, or incorrect keys.
See it in action: a trouble-free way to do lookups with any data
3. Left Join
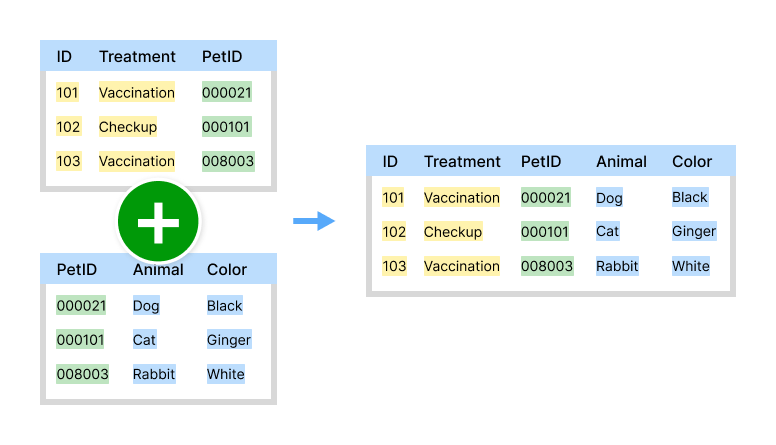
A left join combines two tables by matching one or more (key) columns in both tables as the basis of the combination. Every record from the main table will be kept. but columns from the second table will be added only where key columns match.
Unlike a simple lookup which only returns one column from the second table, a left join allows you to return multiple columns from the second table.
When to perform a left join
You want to use a left join when you need to bring several fields from a secondary table into your primary table.
Examples would include adding multiple customer attributes to sales data, adding employee details including department and manager to human resources data, combining product data with category details, supplier details and pricing details, etc…
Potential problems with left joins
The largest potential risk associated with left joins is having duplicate keys within the second table.
Where there are duplicate values in the second table's join key(s), the left join may multiply rows unexpectedly. This can cause issues if you rely on row counts to generate revenue totals, transaction count totals, aggregates, or other calculations based on the number of rows returned.
Where there are duplicate join key(s) in both tables, the problem is multiplied and the resulting data can contain many more rows than the original. This double duplication is known as the “cartesian product”.
Example: if you have an invoice table containing two records each with the same customer id and also have two separate records in your customer table for that same customer id, when you perform a left join on those fields you may get four combined rows instead of two.
This type of issue can inflate revenue totals or transaction counts without notice until much later in time when reporting is done at the end of the month or quarter.
How to prevent errors prior to performing a left join:
- Profile your join keys in both tables.
- Review your join keys for blanks, duplicates & different formatting styles.
- Confirm whether the relationship between the tables is one-to-one, one-to-many or many-to-many.
- Review your merged/matched and unmatched records separately.
- Compare your total record counts before and after the join.
- Investigate why you got unexpected increases in records.
See it in action: an easy way to perform left joins
4. Fuzzy Matching
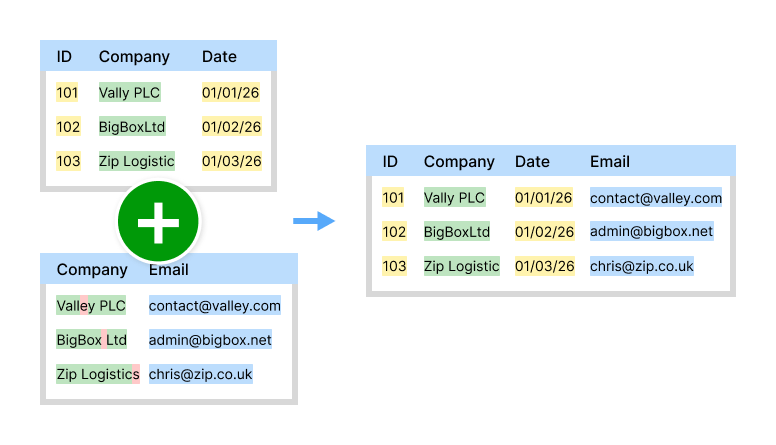
Fuzzy Matching compares values that have similarities but do not exactly match. It has a pre-defined acceptable level of similarity. This is helpful when there are typing errors, formatting differences, or when name conventions vary.
Use this when
- Customer names have been entered in different ways across different systems.
- Addresses include various abbreviations.
- Product descriptions slightly vary in wording.
- Typographical errors exist, or extra spaces or different spelling occur in Names.
- No exact lookup key or join keys are available.
Examples of Fuzzy Matching would be "Acme Corporation," "ACME Corp", and "Acme Corporate" could represent the same company but would result in no match from an exact-match search.
What can go wrong
While Fuzzy Matching can provide significant benefit, it does require close evaluation. A similarity threshold that is set too permissive will produce incorrect related matches. When it is too restrictive, it will cause true matches to miss. Additionally, manual data entry variations may result in false positive matches, especially when Customer Names, Addresses, and others have many similarities.
How to avoid errors to safely use Fuzzy Matching:
- Clean-up all text prior to matching (trimming spaces, capitalization consistency).
- Eliminate any unnecessary punctuation or common suffixes (if applicable).
- Begin with a conservative similarity threshold.
- Manually review all proposed matches before acceptance.
- Do not delete unmatched records prior to manual evaluation.
- Validate high-value/risk matches using another field (e.g., location, email address, account number).
Important: Fuzzy Matching should never be assumed as 100% reliable; rather, treat it as a controlled process with visible results,clearly defined validation, and possible additional correction.
See it in action: a simple way to perform fuzzy matching
5. Interval Merges
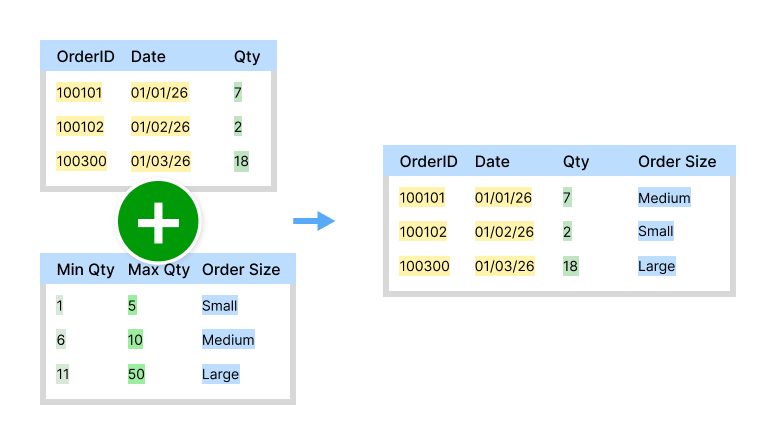
An interval merge maps a value in one table to a starting point and ending point in another table where the values represent intervals (ranges, time periods, etc.). Example: invoice date mapping to financial period.
When Interval merging is particularly good at:
- Mapping invoice dates to the corresponding financial year/period.
- Assigning a transaction to a fiscal quarter.
- Monitoring slow-changing dimension e.g. Account manager ownership changes over time.
- Map values to pricing tiers/commission brackets.
- Classification of uneven numerical range (e.g., grouping customers into age groups).
Example: a business assigns commissions to salesmen based upon the sale price. An interval merge allows mapping of each sale price to the appropriate commission rate.
What can go wrong
Incorrect boundary values are the most commonly occurring issue. If a beginning date/end date/range boundary/effective period is incorrect, then either the transaction may fail to map correctly or it may be mapped to the wrong time period. Overlapping intervals can generate double entries while intervals without verlap may lead to unmerged records.
How to avoid errors before performing an interval merge:
- Verify that both Start dates and end dates/boundaries are complete and accurate.
- Identify and verify for intervals.
- Establish whether boundary values are inclusive or exclusive.
- Perform a review of unmerged records.
- Test edge cases, i.e. Beginning and ending days of intervals.
- Validate total amounts by time period after performing the merge.
In financial reporting, payroll, commissions, historical assignments of accounts etc., these steps must be taken because a small error in boundaries will affect many more records than just one.
See it in action: a way to perform interval merges
Other Methods for Combining Data
There are several additional types of merges beyond those previously discussed (i.e. append, lookup, left outer join, fuzzy matching, interval merge) that may have application in your organization.
Inner Join
An inner join will produce only the records where there exists at least one record in both tables.
When you want to see only records that exist in both tables (e.g. customers listed in your CRM exports and your marketing lists).
Full Outer Join
A full outer join produces all of the records found in both tables regardless of whether they exist in the second table.
When comparing two different datasets or trying to find records that exist in one dataset but not the other.
Cross-Merge
A cross-merge produces every possible combination of rows from the two tables.
In limited instances you might use this method to generate all possible product/region combinations. Be aware that using this type of merge may rapidly expand your dataset into an unmanageable size.
Natural Merge
A natural merge allows you to use fields with identical names in each table as the key field(s) to merge on. It can be convenient when key fields can’t be specified in advance and should be defined during data processing.
Benefits of Using EasyMorph to Automate Your Data Merges
Data merging requires more than just selecting the correct type of merge. In addition, the quality of the merged data is dependent upon how much insight you have into what occurred prior to reaching a decision-making point (such as a dashboard, report, or business system).
EasyMorph is a powerful, visual, and automated solution designed for non-technical users to visually transform their data (without coding), including combining, cleaning, validating and automating data. Unlike providing a view of a few hundred records, EasyMorph provides you with an opportunity to visually inspect all the output data throughout the workflow and to build validation steps before sending out final results.
Regardless of whether you are adding spreadsheet data together, looking up information across two different spreadsheets, linking similar tables together, matching data points that were entered differently, or applying transactional activity to time-based data ranges, EasyMorph makes validation part of every merge so that errors are identified and resolved before they impact your business's ability to make informed decisions.
If you want to try EasyMorph to merge your data, we have a forever free version you can download now: