Boards are one of my favorite features of EasyMorph Server. In more than 20 years working in IT, data and business intelligence, I've yet to come across a comparable tool. So let's take a dive into what Boards are and aren't, as well as some of the powerful ways you can use EasyMorph Server Boards within your organization.
EasyMorph Server Explorer
Before getting into the details, I should first mention Explorer. Explorer is a feature of EasyMorph Server and comprises two main capabilities, the Catalog as well as Boards.
If you have EasyMorph Server Team or Enterprise edition, then you already have Explorer, including the full capabilities of Boards, available for use in a single Space. Once Explorer is enabled within the Space features, you can then create as many Boards as you need.
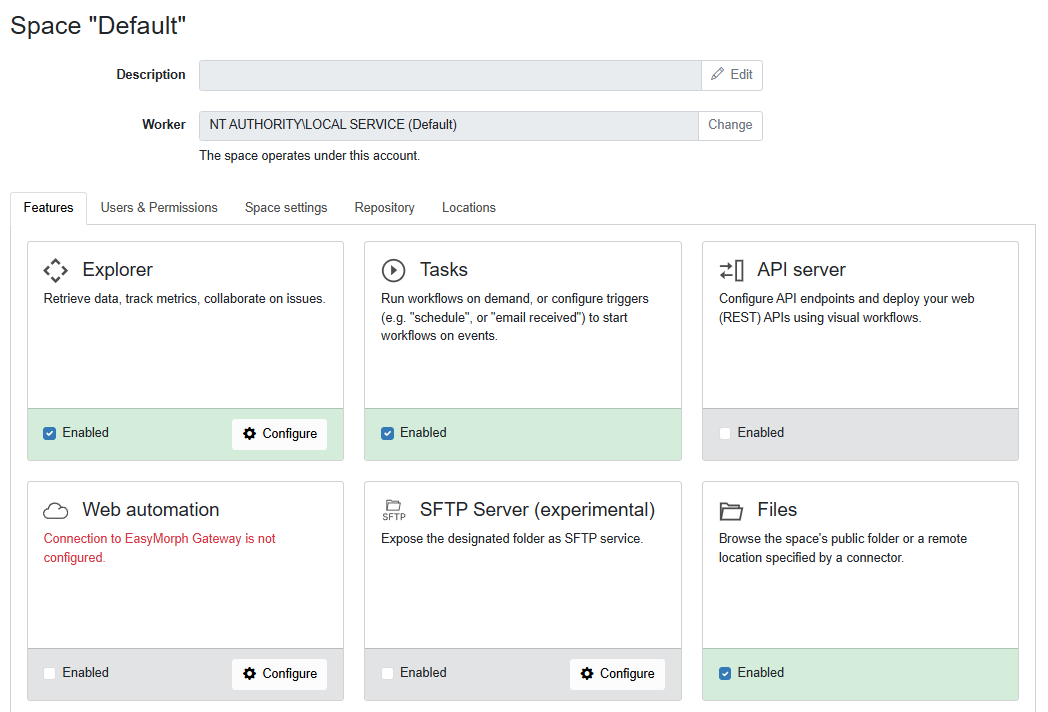
Note: Because permissions in EasyMorph Server are managed at the Space level, any users with access to the Space will be able to access all Boards within the Space. Explorer can be enabled in all Spaces by purchasing the EasyMorph Server Explorer Add-on.
So what are Boards?
Because Boards are unique and the potential use cases are boundless, it can be a little difficult to quickly and simply describe what they are exactly. But here goes...
I like to think of Boards as a set of tools which allow me to create customizable homepages for any team, business function, operational process or project. From monitoring complex ETL workflows running in EasyMorph, to providing a simple homepage for your users to find the links, data assets and reports they need - Boards can be configured to serve many purposes. In order to help demonstrate what Boards can do and their potential uses within any organization, let's consider a fictional business, with a very common and real business problem, creating an EasyMorph Server Board to help.
Our fictional business receives orders from customers electronically, which are then processed through a complex set of EasyMorph workflows, finally ending up in the manufacturing system. A small number of orders fail this automated processing due to incorrect information, improper formatting or because they fail credit or payment checks. Historically, the Sales Team has very poor visibility of these data quality problems, only finding out about them when they receive a weekly report, or more often, when the customer contacts them because they haven’t received confirmation of their order.
With this problem in mind, let's start by creating a Board to give the sales team real-time visibility of the orders being processed and importantly, if any orders have failed.
Creating a Board
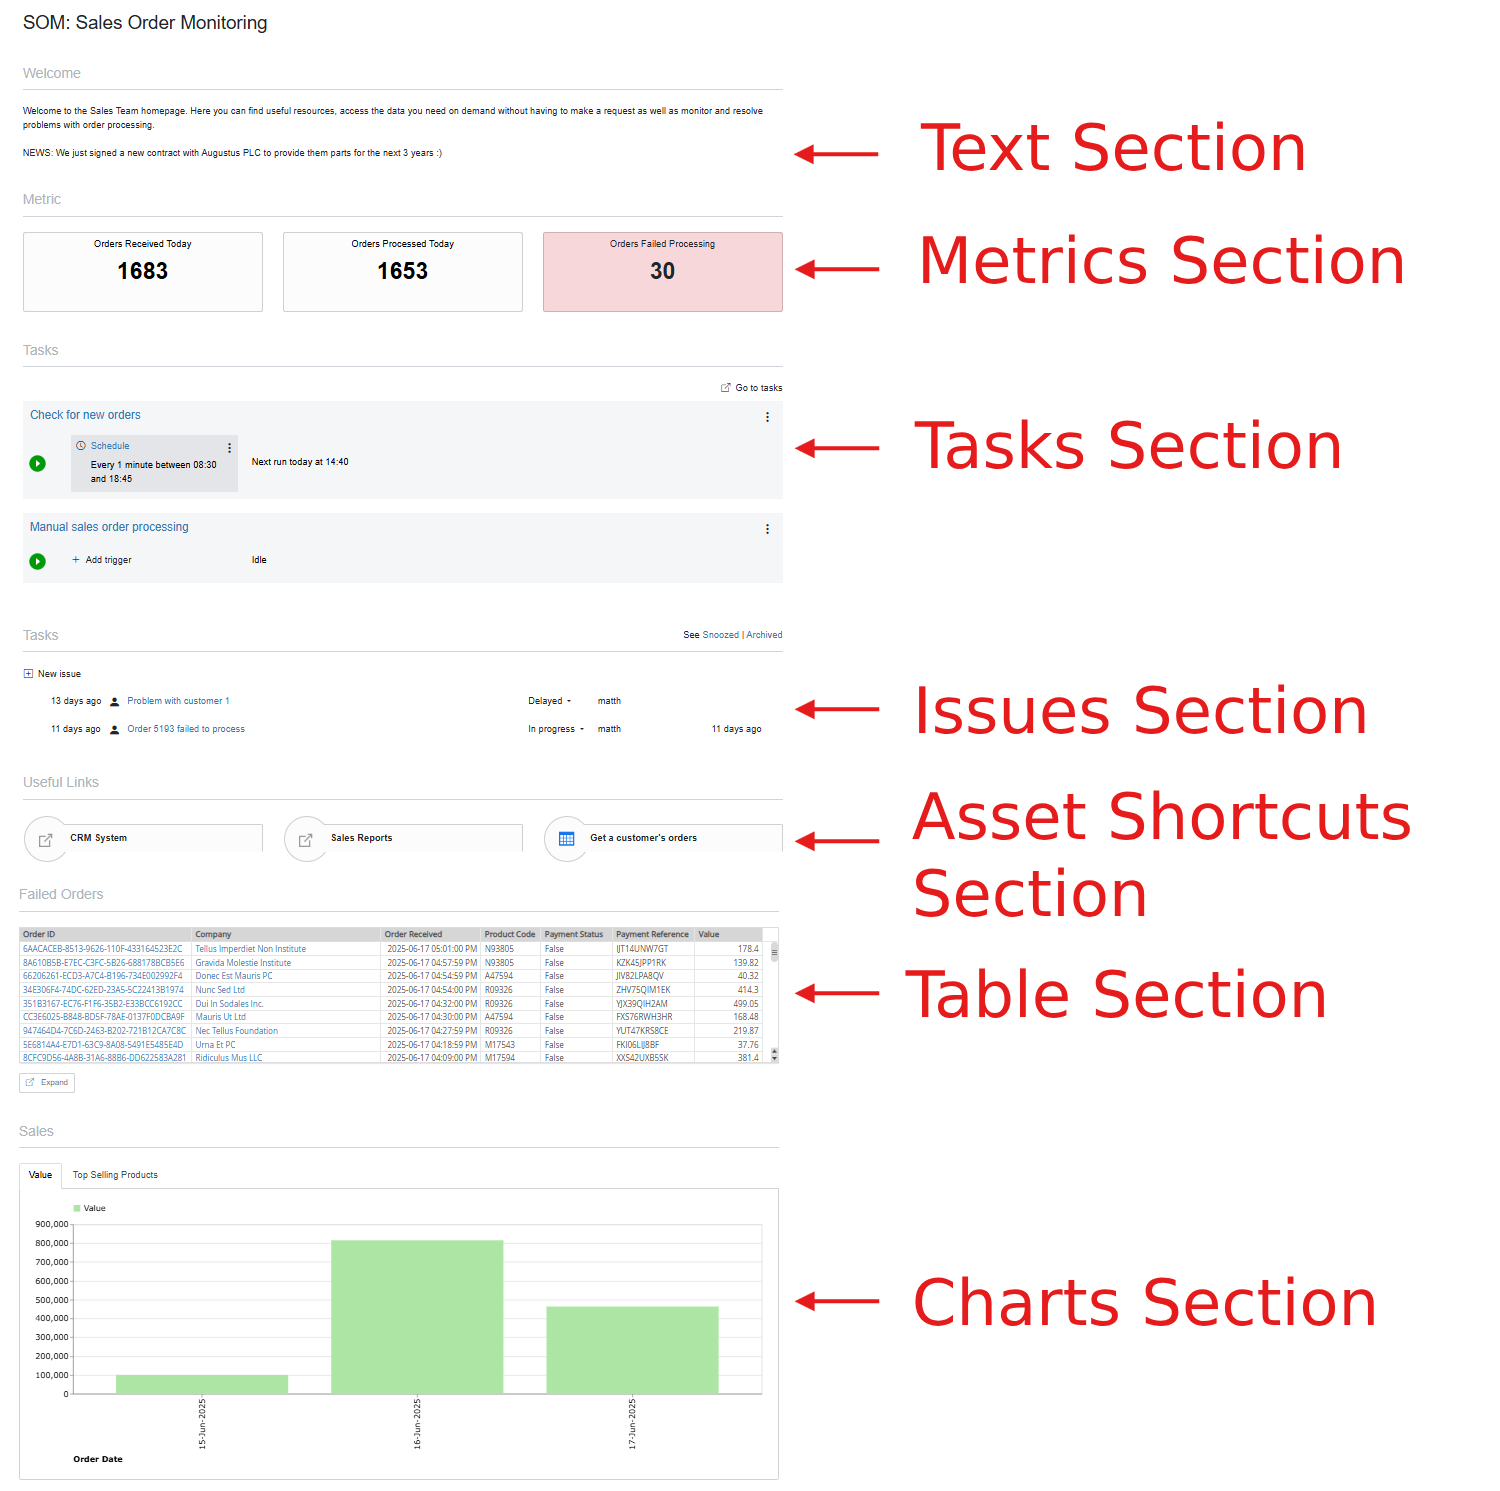
Creating a Board is simple. Within Explorer I can add a new Board, giving it a name (such as Sales Order Monitoring) and a unique 3-digit code which will serve as the link directly to the Board. And finally, select the Sections which I want to include on the Board (more on Sections in a second).
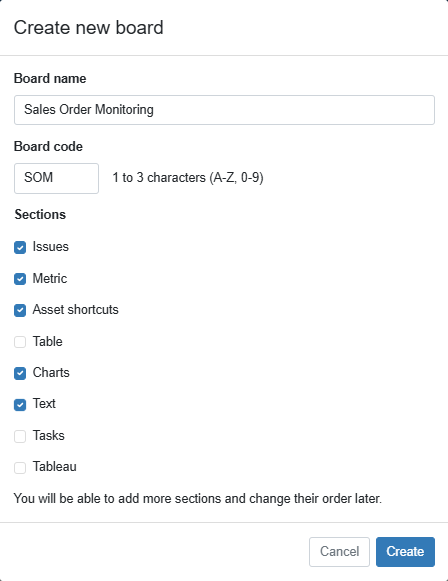
You can create as many Boards in a Space as you need, adding the required sections and configuring each to meet a specific business need or solve a specific problem.
What are Sections?
Each Board in EasyMorph is made up of one or more Sections. Sections provide the different elements and functionality that make up the Board and so I like to think of them as the building blocks which can be put together in different orders and configured in different ways to give the Board the desired functionality. This customizability is what makes Boards so flexible.
Let's look at the most commonly used sections, as we add each to our Board, helping our sales team with the problem they are facing.
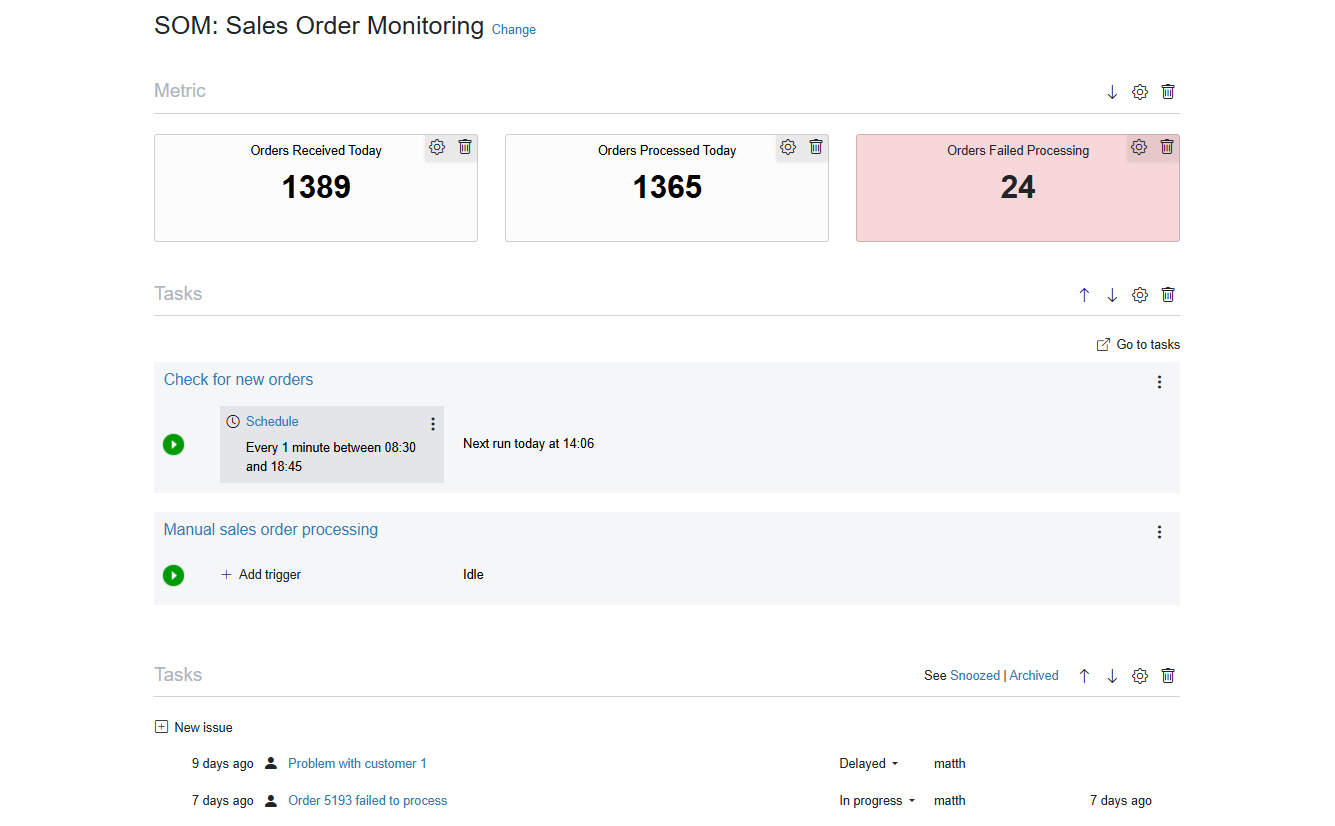
The Metric section
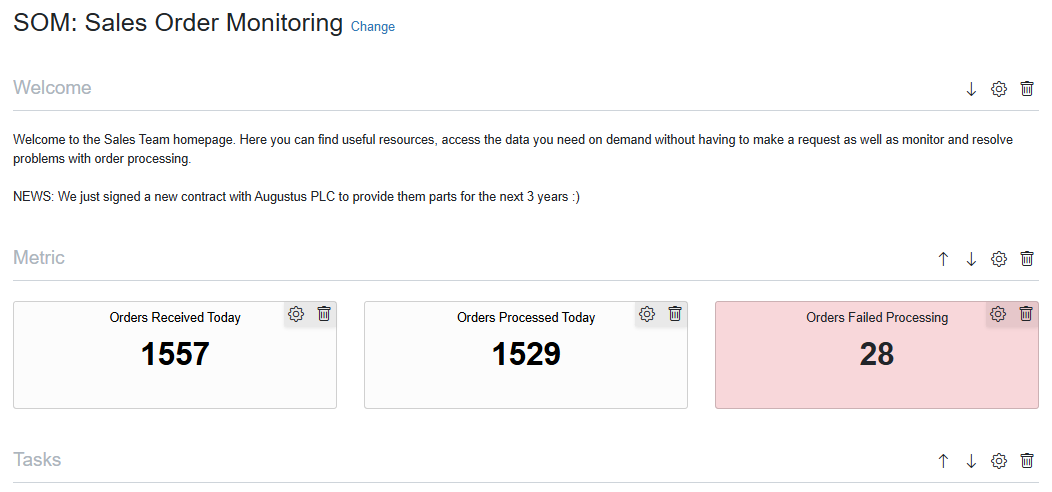
To give our Sales team better visibility, I’ll begin by adding a Metric section to our board. Metric sections allow us to add any numeric metric - or key performance indicator - to a Board. These metrics then update in near real-time without needing to refresh the browser page and can also be conditionally formatted to highlight good or bad values.
In this case, I can add metrics for the number of orders received to today, how many have been successfully processed and, most importantly, how many have failed automated processing. My Sales team now monitor the flow of sales orders in real-time and has immediate feedback that an order has failed processing.
The uses of metrics are almost endless. Keep track of orders received and processed today as we have above, show your year-to-date turnover and profit, or monitor the efficiency of your manufacturing machines. If you can calculate it in an EasyMorph workflow, you can display it as a metric on an EasyMorph Board.
The Tasks Section
As well as orders being received electronically, our fictional sales team also take a small number manually, via email or over the phone. When this happens, the sales person fills out an order form and saves it to a network folder. Each night an EasyMorph task runs to process these manual orders, but sometimes the order is urgent and so it would be better if the sales person could manually trigger the relevant task when needed. They can already do this, but can be difficult for them to find the correct task in the large number of tasks which are configured on our EasyMorph Server.
To make it much simpler, we can add a Tasks Section to our Board and configure it to only show the subset of tasks which are relevant to order processing.
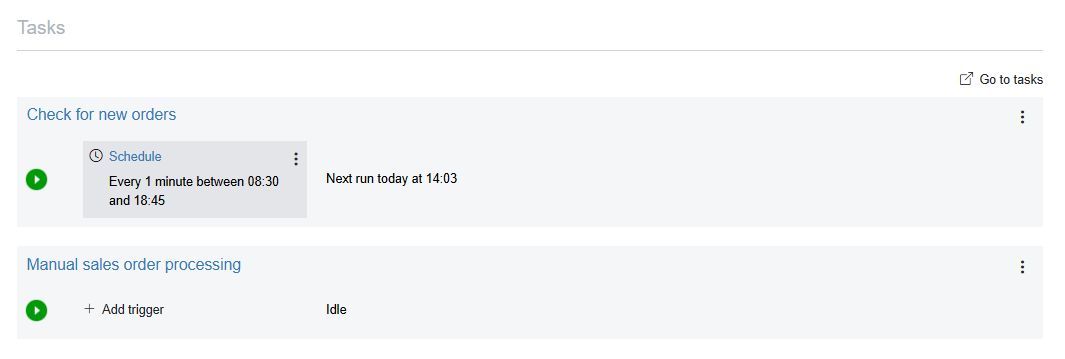
Noe, as well as being able to manually trigger the tasks when needed, our Sales team are able to see if the tasks last ran successfully, helping them to pro-actively monitor whether or not the automated order processing is working as expected.
The Issues Section
Having visibility of a problem is just the first step. We need to assign these failed orders to a member of the team, so that they can investigate the cause and decide the best course of action. The Issues Section adds the ability to create a simple ticketing or to-do list and place it on a Board. Each issue created can have a type, a description, a due date, a status and can be assigned to a specific EasyMorph user. The types and statuses of Issues can be fully customized to meet the needs of each use case.
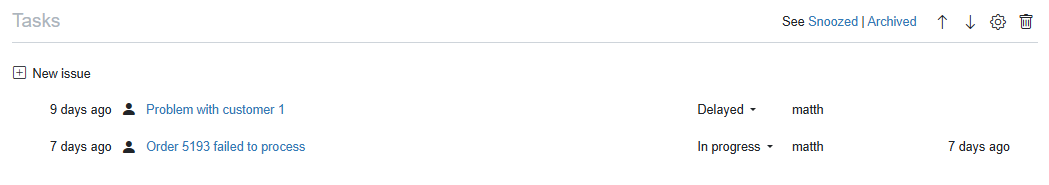
Now, when an order fails, the sales director can use this Issues Section to create an issue and assign a team member to investigate the problem and monitor their progress. Issues can even have attachments, meaning we can attach the relevant data set or a link to the failed order file. Or better still, because issues can be created, listed and archived via Actions in EasyMorph workflows, we can also automate the creation and assignment of issues when an order fails to process.
This ability to close the loop between data processing and human intervention is powerful and unique to EasyMorph. And because of their customizable types and statuses, the potential uses of issues go far beyond traditional issue tracking as we see here. Use them as a simple project management tool, creating an Issue for each task, assigning it to the relevant person and tracking when they are due and completed. Or even create an Issue for each room in a hospital emergency department, monitoring if it is in use or available, the severity of the case and which doctor is assigned.
Our Board is now taking shape - beginning to become a really useful tool for out sales team.
The Asset Shortcuts Section
Now that we’ve dramatically improved our Sales team’s visibility of order processing and helped them to investigate the causes of any problems, we can begin to add more functionality to our Board to make it a really useful homepage for the team. Let’s begin by adding links to the most common resources and systems the Sales Team use - such as our CRM system and the sales section of reports in our BI tool. To do this, we can add the Asset Shortcuts section to our Boards, and add the relevant links.
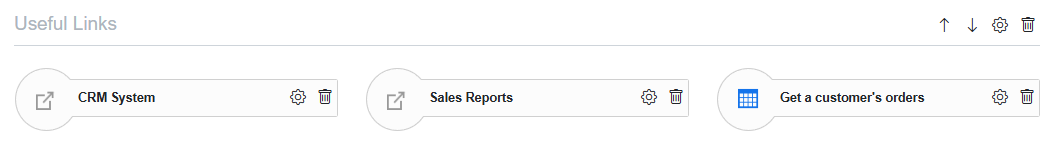
As well as simple web links, Asset Shortcuts can also link to assets in the EasyMorph Catalog. Because the Catalog supports many types of both static and dynamically created assets, shortcuts on Boards can do a lot more than simple hyperlinks. In the the above you can see that I've also added a shortcut to a dynamic data set titled Get a customer's orders, which when clicked, prompts our Sales team to input a specific customer ID and generates a full list of all orders for that customer. Now they can self-service the data they need in a secure and governed manner, without having to write any SQL or relying on our data and BI teams. We can even add a shortcut to the network folder where they need to place manual orders before triggering the task which processes them.
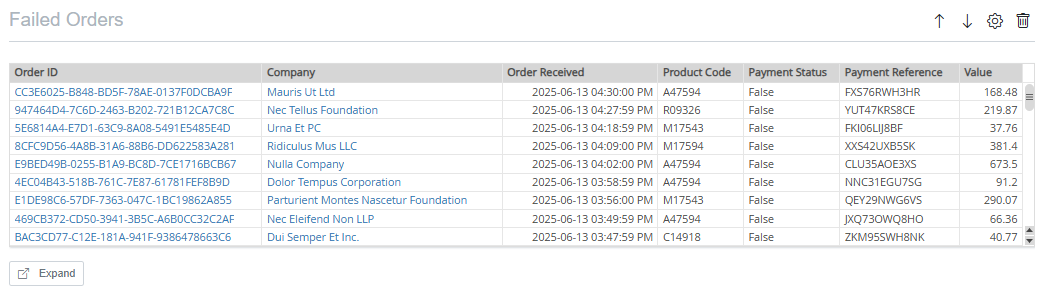
The Table Section
Boards are not intended to be business intelligence dashboards, but we can of course add charts and tables of data so that the most important information is available directly in our Board, preventing the Sales team from having to navigate to a separate BI or reporting system. Let’s add a Table section to our Board and populate it with a list of orders which have failed processing. This saves our Sales team another job making this information instantly available to them in real-time, without having to find and run a separate report. Tables in EasyMorph Boards can be expanded to full screen if needed, and can also be filtered and even be downloaded as as a DSET, CSV or other supported file type.
Whilst simply displaying this tabular data to our sales team is of course beneficial, the real power of the Table section lies in the ability to add commands. As can be seen above, Commands appear in the table as blue underlined links much like on web pages. When clicked, they call EasyMorph workflows, passing one or more record values from the table, and returning a result if required. As an example, one of the most common reasons our orders fail to process is because the payment wasn’t approved. Adding a command to our table allows our Sales team to change the payment approval directly from the Board. This is yet another way in which Boards can offer much more than the one-way street provided by typical BI tools. I can also use commands to link to other relevant data sets. Clicking on the customer in the table runs a command which returns all orders from this customer. This ability to link relevant data sets together allows users to easily find and explore more data than can be displayed in a single table.
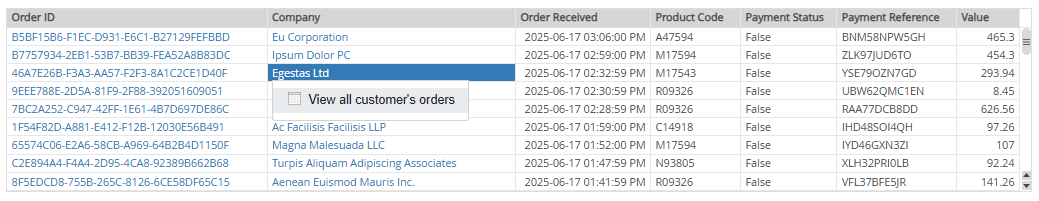
Yet again, if you can build an EasyMorph workflow to achieve it, you can add a Command to a Table section to achieve it.
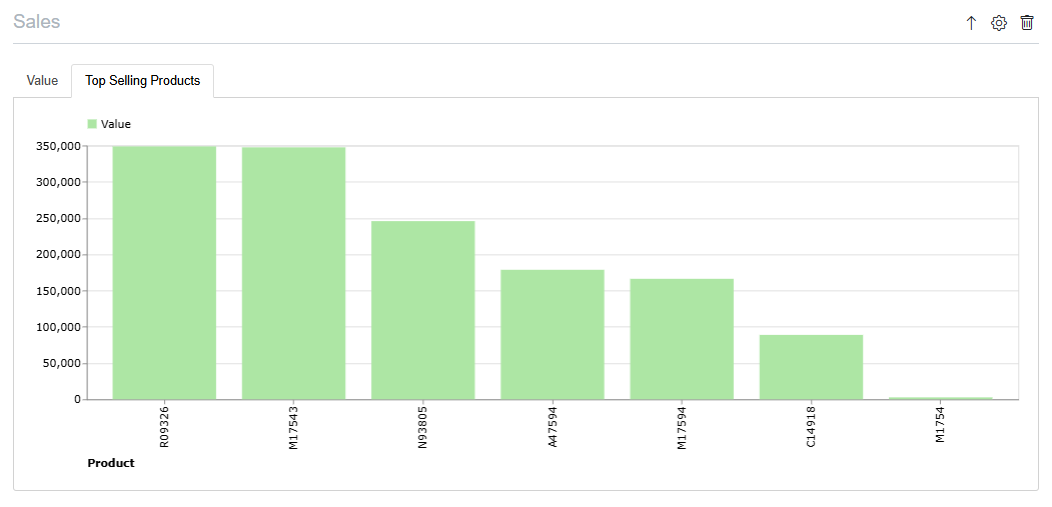
The Charts Section
And of course, we can also add one or more simple charts to our Board using the Charts Section. Any chart that can be created in EasyMorph Desktop can be embedded, including bar charts, line charts and even cross table charts (A.K.A. pivot tables). And like metrics and tables, Charts in Boards can update in near real-time as the underlying data is processed through EasyMorph workflows.
Being able to combine quantitative information using metric, chart and table sections; with qualitative information using task and issue sections; makes our Board a true homepage for our Sales Team to manage all aspects of their day-to-day operations.
The Text Section
And lastly, let’s add a short description of the board using the Text Section, welcoming the users and explaining what is available in this new homepage. Having it at the bottom of the Board doesn't make much sense, so I can reorder the sections into the layout which makes the most sense; putting our description at the top of our Board.
In only a few minutes, we’ve created a Board providing our Sales team with better visibility of the processing of orders in near real-time, highlighting any problems that occur and providing them easy access to the sources and tools they need to keep orders flowing smoothly.
Other use cases for Boards
The potential use cases and benefits of Easymorph Boards are vast, and we’ve only scratched the surface with the above example. Hopefully it’s at least given you a better understanding of Boards and how they can be created quickly, without writing a single line of code. Boards can benefit any team, function, region or subject area - such as:
- Take the pressure off your data and reporting teams - creating a board for your business users to self-serve the data they need, whilst # promoting collaboration with the technical teams when needed.
- Let your finance team manage month end - seeing the progress of their month end process, highlighting any data quality or reconciliation issues that might exist, and allowing them to download and validate the data. Even allow them to manually releasing the data to the rest of the business when ready.
- help your HR team manage recruitment - collaborating with the rest of the business on recruiting new people - handling requests, giving hiring managers visibility at each step of the process, through to onboarding new starters.
The potential uses for EasyMorph Boards within your business are almost endless.
What Boards are not
Hopefully, you now have a better understanding of Boards and what they can do. When talking to customers about Boards, I sometimes come across some assumptions as to what Boards are, such as being business intelligence dashboards. This is possibly due to the similar name, but also because some boards can look very similar to a BI dashboard if they only contain metrics, charts and tabular data. There is one major difference however. BI and reporting tools are a one-way street, providing data to users, sometimes even allowing them to self-service their needs. And if all of our business data was clean and perfectly formatted, that might be all we need. Unfortunately, in the real world, data almost always contains missing values, input errors and other data quality problems. Wouldn’t it be a game changer if our users could correct these data quality problems as they identify them, without having to raise a request to the data team or dig through the appropriate business system to find the right record. Because of the abilities of Boards such as Asset Shortcuts and Table Commands, In EasyMorph Boards they can do just that - turning the one-way data street into a two-way data highway.
Because Boards don’t need to contain any data tables or visualizations, it could be also said that Boards are akin to a “no-code” web application building tool. However, this again isn’t a perfect comparison. For a start, many such “no-code” tools would probably be better described as “low-code”, especially when trying to integrate data from other systems and sources. Unsurprisingly, being built-in to EasyMorph means we likely already have this data available and if not, we can use EasyMorphs familiar, easy to learn, no-code, drag-and-drop interface to build the data or business system automation process we need.
I've even heard of Boards being compared to SharePoint sites. Again there are some comparable features, such as being able to configure a site with the elements needed to provide the required functionality. But as with no-code application building tools, the minute you need to integrate data or create anything more complex than the very basic of functionality, the need to write code starts to creep back in.
This is why, I like to think of the Sections that make up Boards as a toolkit of building blocks, to build homepages to monitor and manage and technical, data or business process.
More Information
For more information on EasyMorph Server Boards, including how you can implement any of the ideas or features covered in this video, head over to the EasyMorph Community at EasyMorph.com. We’d love to hear how you are using EasyMorph Server Boards or any ideas you might have for new Sections.
To get the EasyMorph Server Explorer Add-on, enabling Explorer Catalog and Boards for all spaces on your EasyMorph Server, contact us today, by emailing sales@easymorph.com.