Data analysts work with lots of data coming from different sources and in different formats. They frequently need to merge data, calculate metrics, analyze trends and answer ad-hoc questions. Many analysts use Excel for this job as they simply are not aware about alternatives that can be more appropriate for this task. EasyMorph is a purpose-built tool for data analysts to simplify and automate daily data-related operations and reduce tedious manual work. It's easy to learn and has a big, active community of users from all over the world.

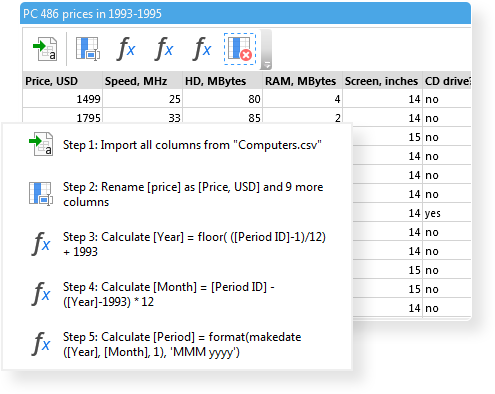
In EasyMorph you manipulate data visually, by transforming it on the fly. Query databases, load multiple files at once, pull data from web APIs and use more than 150 built-in transformations and actions in a visual way without coding. Visual representation of calculations is much better than complex formulas and obscure VBA macros. It helps you see clearly the business logic behind calculations, find errors, and make modifications.

EasyMorph is perfectly suitable for extracting data from spreadsheets, because just as in Excel, in EasyMorph text and numbers can be mixed in the same column — a capability many other data tools lack. Data types in EasyMorph (e.g. dates) are the same as in Excel. This, and many built-in Excel-specific transforms make EasyMorph an ideal tool for dealing with spreadsheets.

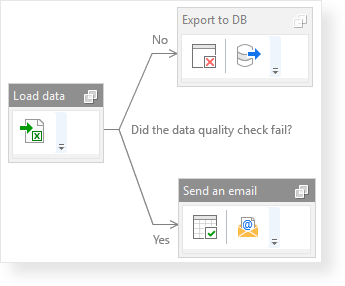
EasyMorph is designed for data-aware automation without coding. Advanced parameterized workflows with conditional branching, loops, and subroutines enable automation of even very complex routines.

EasyMorph comes with built-in charts that can provide an insight into trends and patterns. When auto-calculation is ON, charts update automatically when you change filters, or modify actions.
Change dimensions and metrics in charts on the fly by simply dragging table columns in them.