If your team is still working on refreshing data, rebuilding the same reports, and emailing spreadsheets on a consistent basis, you're not alone. According to TechRadar, over 90% of organizations are using Excel manually. But we're living in the 21st century and that means there are solutions like EasyMorph that can automate most repetitive Excel work.
That's why we put together a guide to show you how you can replace repetitive Excel tasks with a simple, reusable workflow that's completely automated. Instead of spending all those grueling hours on Excel reports, you can ingest data, transform it, and send the finished report to the right people or upload it to the storage of your choosing.
Why Teams Are Still Stuck in Manual Reporting
Manual Excel tasks seem easy at first glance. Someone downloads a CSV, pastes it into an Excel file, applies a few formulas or VLOOKUPs, reformats the layout, and sends it off to their coworker. It takes 30 minutes to an hour — not a big deal.
But the problem is not necessarily that it's a one-off task. It's that Excel users and analysts are doing the same task on a monthly, weekly, or even daily basis. Multiply the amount of time that task takes by 52 weeks, add in the occasional data entry errors, and account for the one person who "knows exactly how this Excel workbook works" and you have a fragile, expensive process. That's why manual reporting drains a bunch of time from analysts that could be spent on real business insights and analysis.
Here are a few common symptoms of a broken manual workflow:
- Downloading the same files from email or SharePoint every week or every day
- Cutting and pasting raw data into a template and re-applying the same formatting
- Rebuilding pivot tables or cleaning up data types after every refresh
- Forgetting a step and sending an outdated or broken report
What It Means to Automate Excel Reports
When you automate Excel reports, you replace every manual step with a defined, repeatable process (workflow) that runs on a schedule. The result is consistent, accurate output every time without anyone having to remember what to do.
A fully automated workflow is typically set up in four stages:
- Ingest: Pull raw data from an Excel file, CSV, database, or cloud folder automatically
- Transform: Clean, reshape, and merge the data without manual data manipulation
- Update: Write the results directly into your Excel template, preserving formatting
- Distribute: Send the finished report by email or upload it to SharePoint or a BI dashboard
Step-by-Step: Automating Your Excel Report with EasyMorph
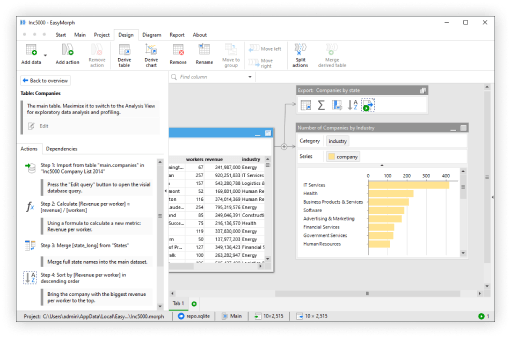
EasyMorph is an advanced data automation tool designed for Excel and data teams who want to automate reports without coding. Unlike Power Query, which still requires manual formatting and can quickly lead to writing lots of obscure M code, EasyMorph is an end-to-end data automation platform that includes many more features such as scheduling, file delivery, or email automation. It's completely visual, so you don't have to write any code or scripts.
Here's how a typical automated Excel workflow is built:
Step 1: Connect Your Data Sources
The first step is to connect EasyMorph to your data sources. Your data source could be a database, a CSV you just downloaded or were given by partners via email, or another Excel file sitting in a shared folder.
It doesn't matter where the data comes from, because EasyMorph can connect to a lot of different databases and storages. Once connected, EasyMorph automatically picks up new files as they arrive, so you don't have to manually download your files.
Example:
Let's say we are recording some kind of project management tracker in Excel, where data is given to us manually by the person in charge of the project. In this use case, we would design a report to hand off to the project manager, who is sending us project completion data every week. Below we see an example of the report, where we see a Gantt chart and the data for each assignee and their project completion percentage.
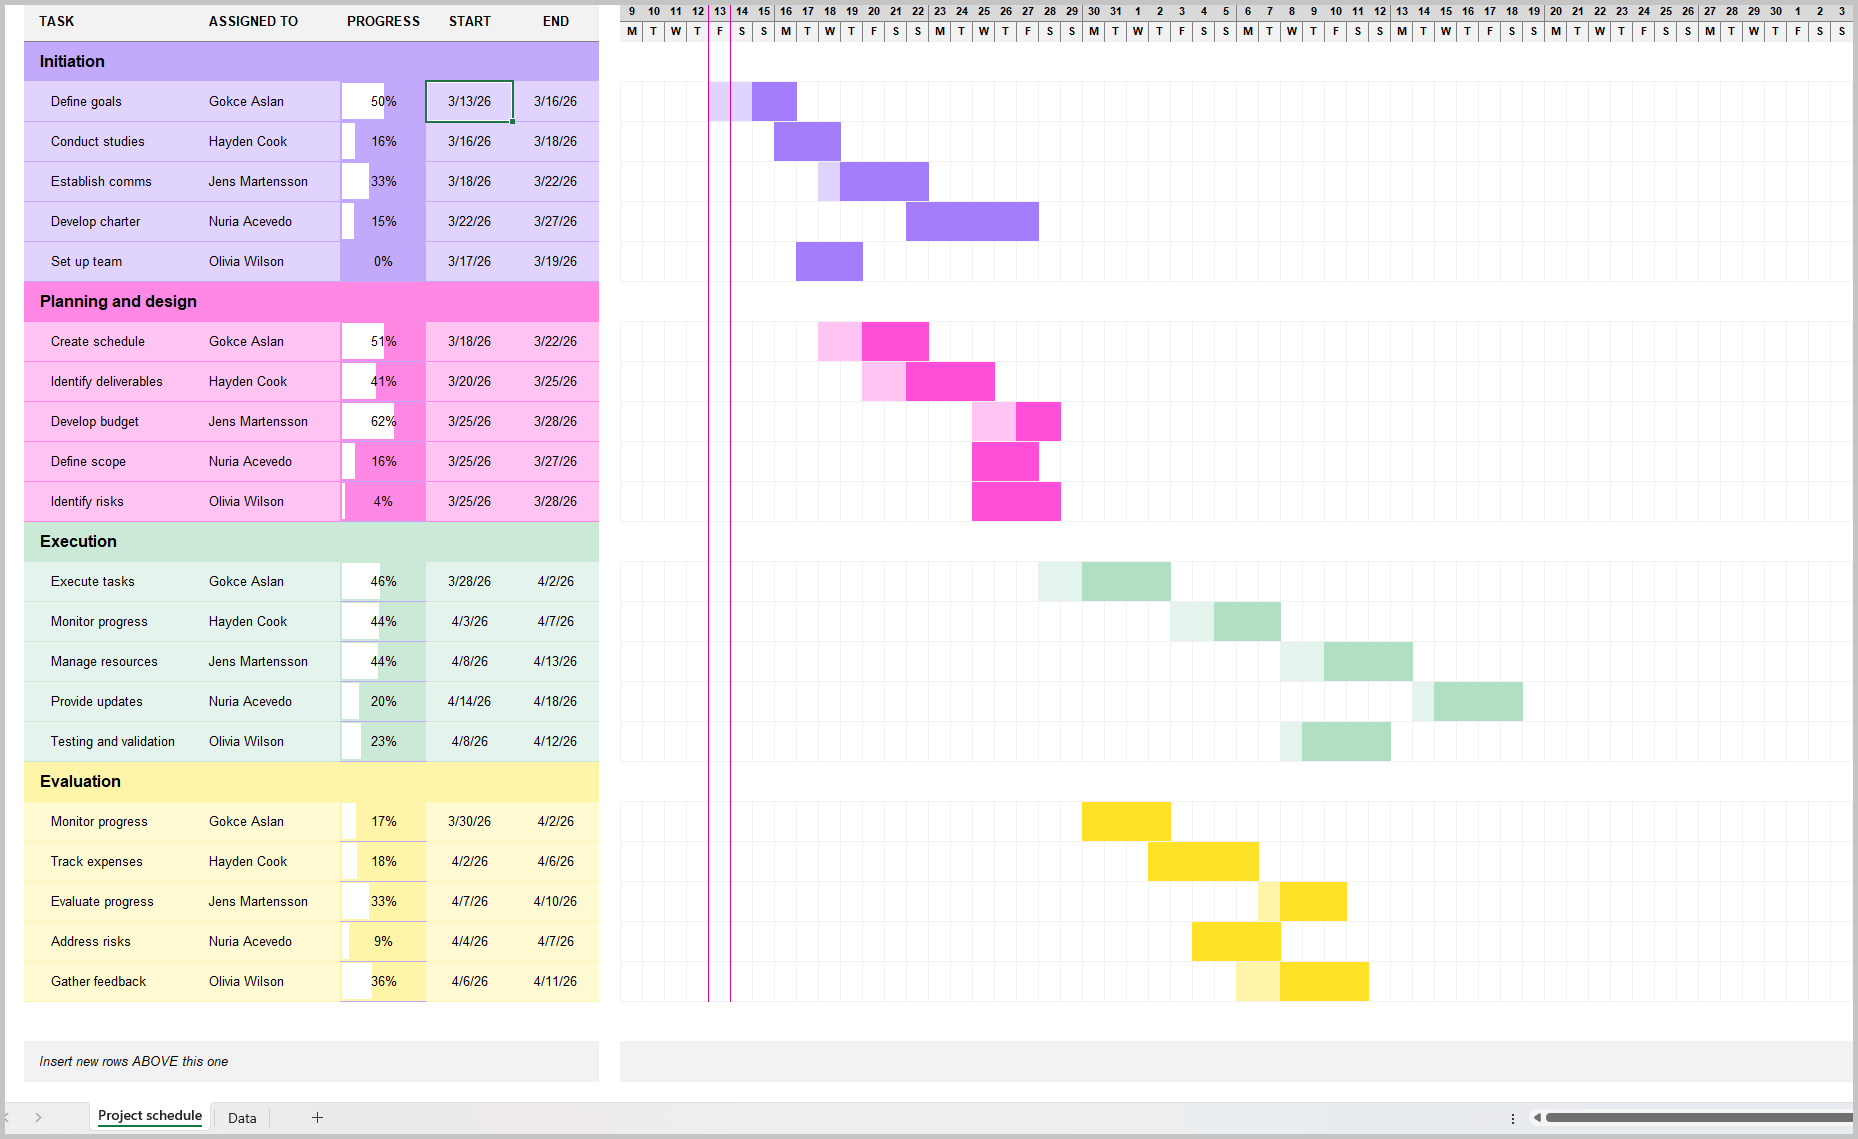
Data that lives inside a secondary tab:
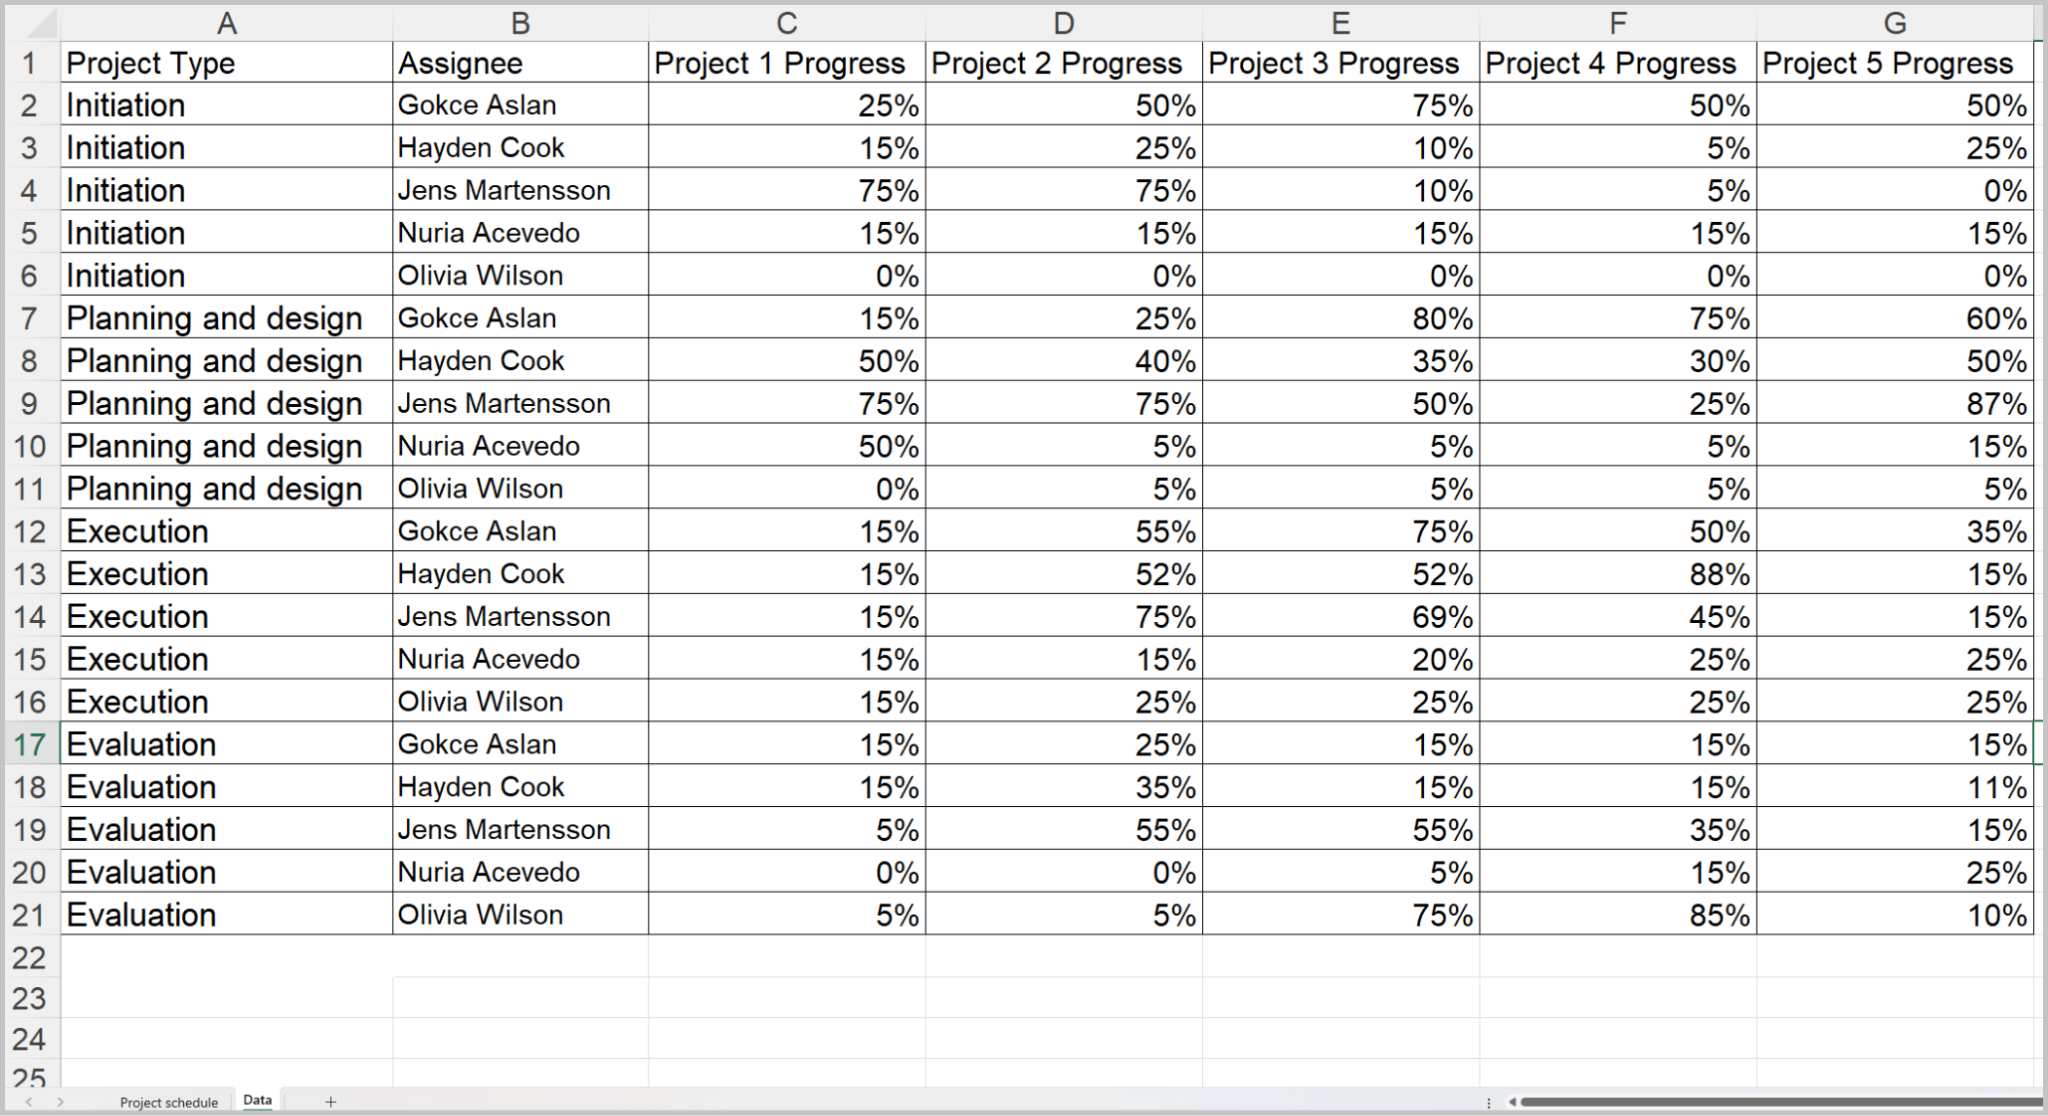
What we want to do is take new data that is received by Google Drive every week, and automatically update the secondary "Data" tab that the progress Gantt report is based on.
So first, we download and install EasyMorph:
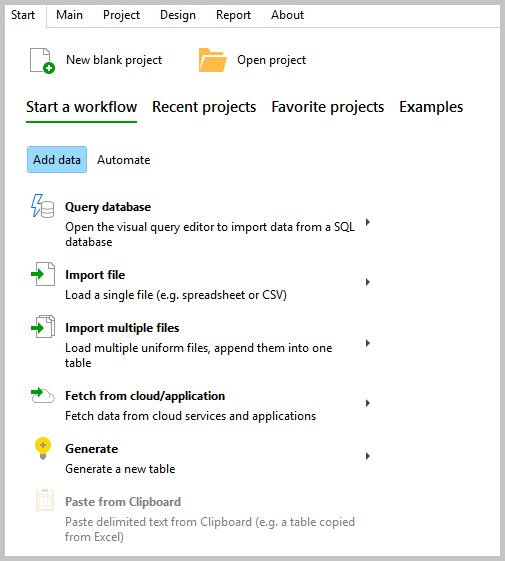
Once installed, we start a new project as shown below.
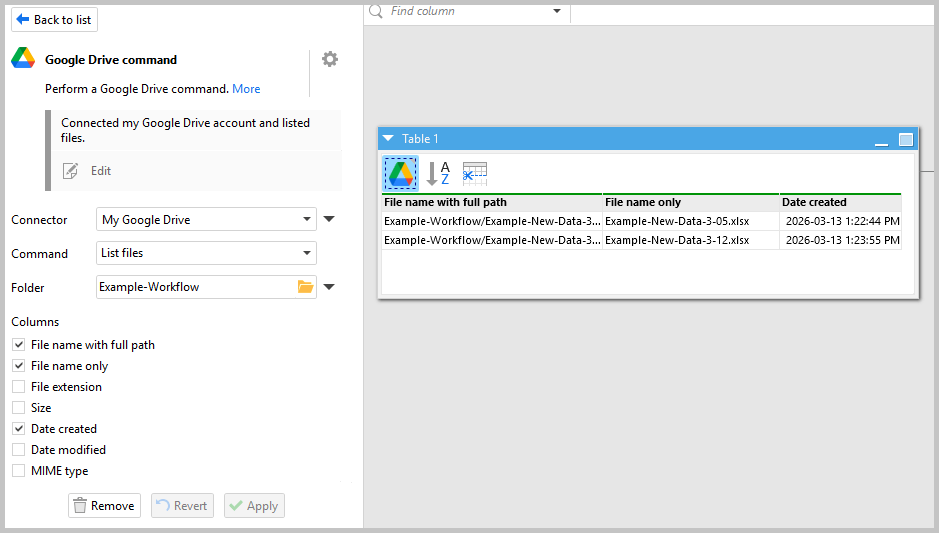
In the workflow below, you'll see that I added a Google Drive command action, and I chose my connector to My Google Drive account (if you don't know how to use connectors, you can check out the tutorial here). Inside the Google Drive command action, I generated a list of files by adding the Google Drive action, to see if there was anything new.
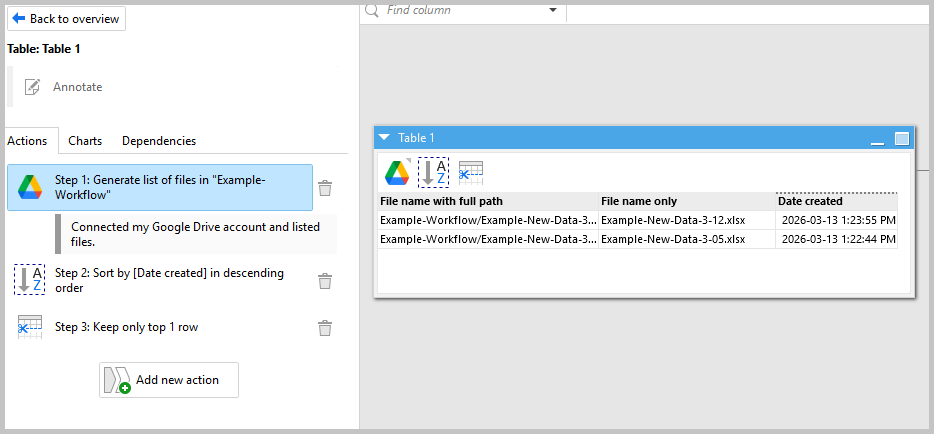
Then I sorted the Date Created by date and kept only the top row (this is important for automation because it will only pull the most recently created data later if you have more than one data file).
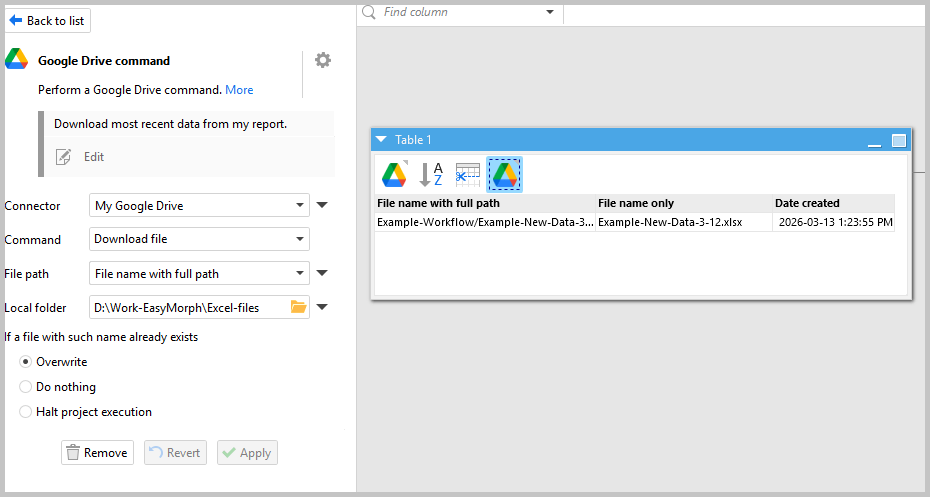
Then I downloaded the most recent file by adding another Google Drive action and selecting "Download File". I chose the "File name with full path" to ensure I could download the corresponding file. If I just choose "File name" (without the full path), it might not download if it's not in the root directory of my Google Drive. Then I saved it locally to the folder I'm working from.
Afterwards, I pulled in my downloaded data by adding the "Import Excel spreadsheet" action, selected the spreadsheet name from our column "File name only" and ran the action.
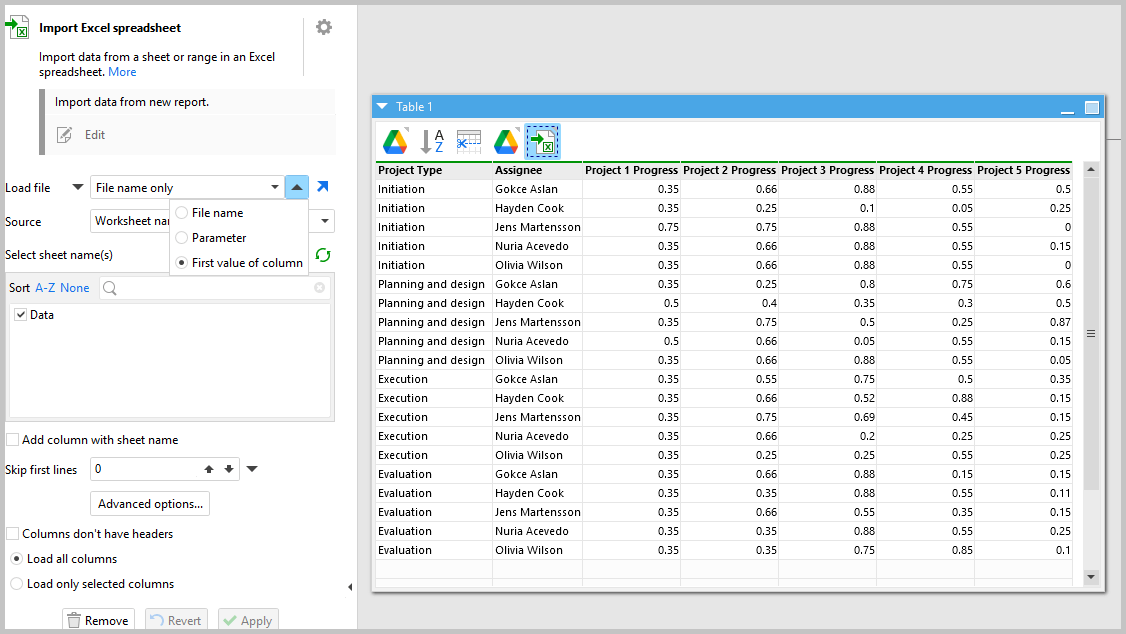
The best part about this step is that it replaces one of the most common repetitive tasks: going into your storage location, going through the new files, downloading them to your local machine, then finally opening the data.
Step 2: Transform the Data
Now that we've automated the data ingestion, we can continue to add steps to our workflow to transform the data. This workflow builder lets you clean, reshape, or transform data so you can get it ready for your Excel report. You can filter rows, rename columns, fix data types, merge sources, and create formulas just like Excel. To make it even easier, EasyMorph's workflow builder is completely drag-and-drop, so you can save a bunch of time building workflows.
Example:
Let's say I was told by the project manager that the progress rate of the assignee is not actually representative of how far along the projects are, but each assignee is 10% less towards progress in project 1. In the example below, I simply added the "Calculate new column" action, reducing the value of the new data by 10% and created a new column called Project 1 Progress.
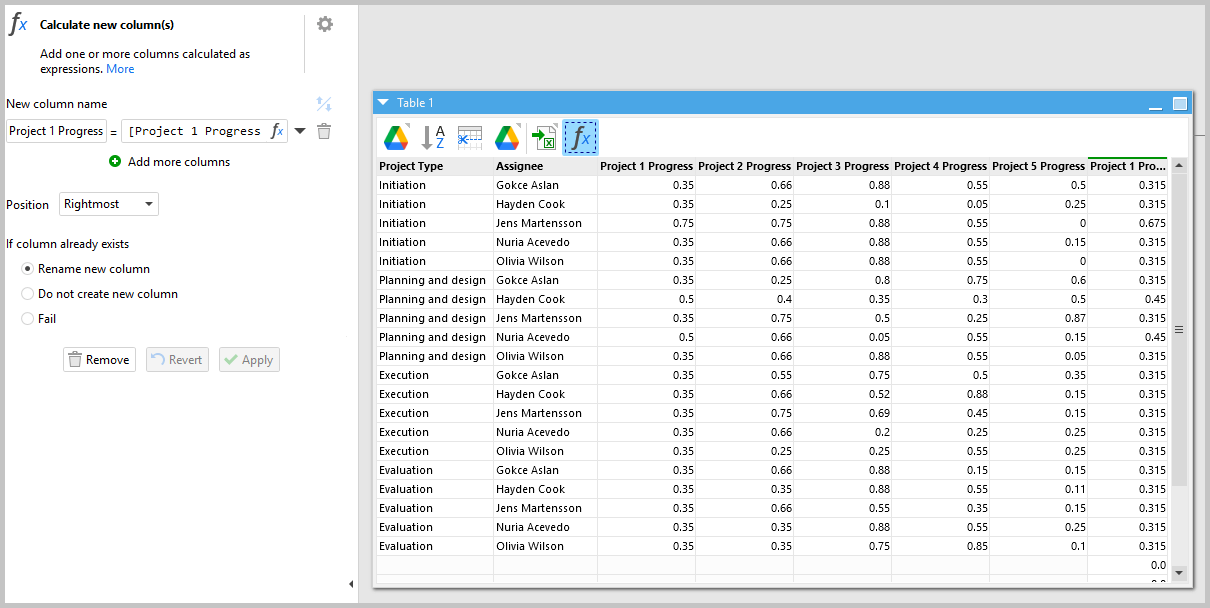
Then I remove the previous Project 1 Progress column.
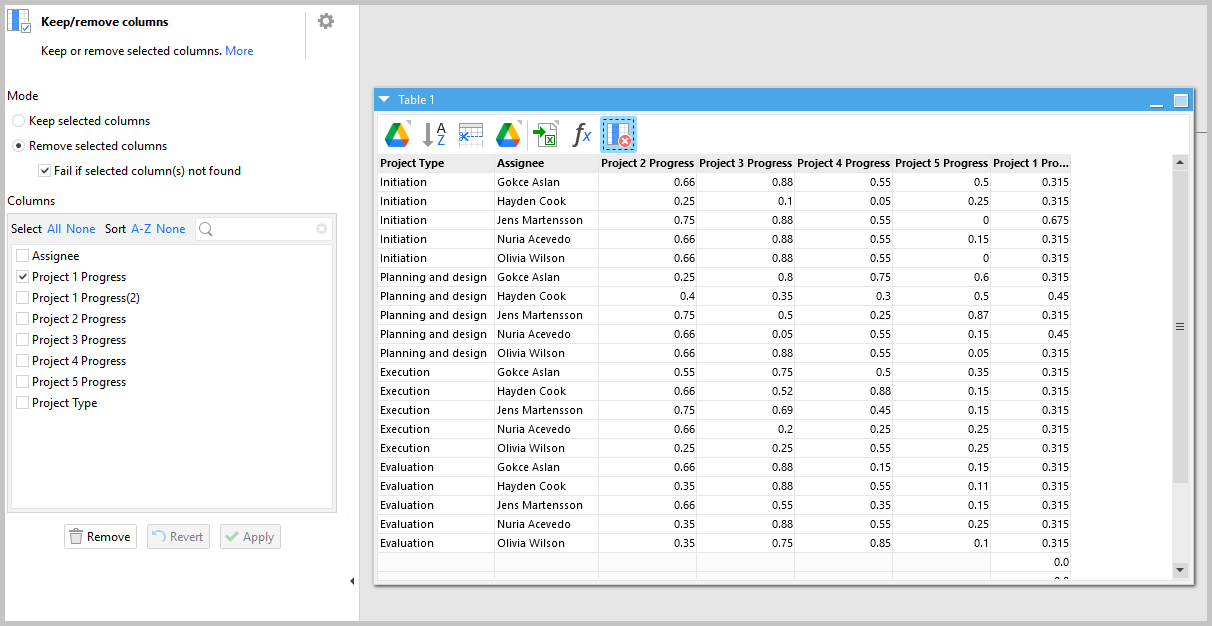
And last, I place the new column where the old column was previously.
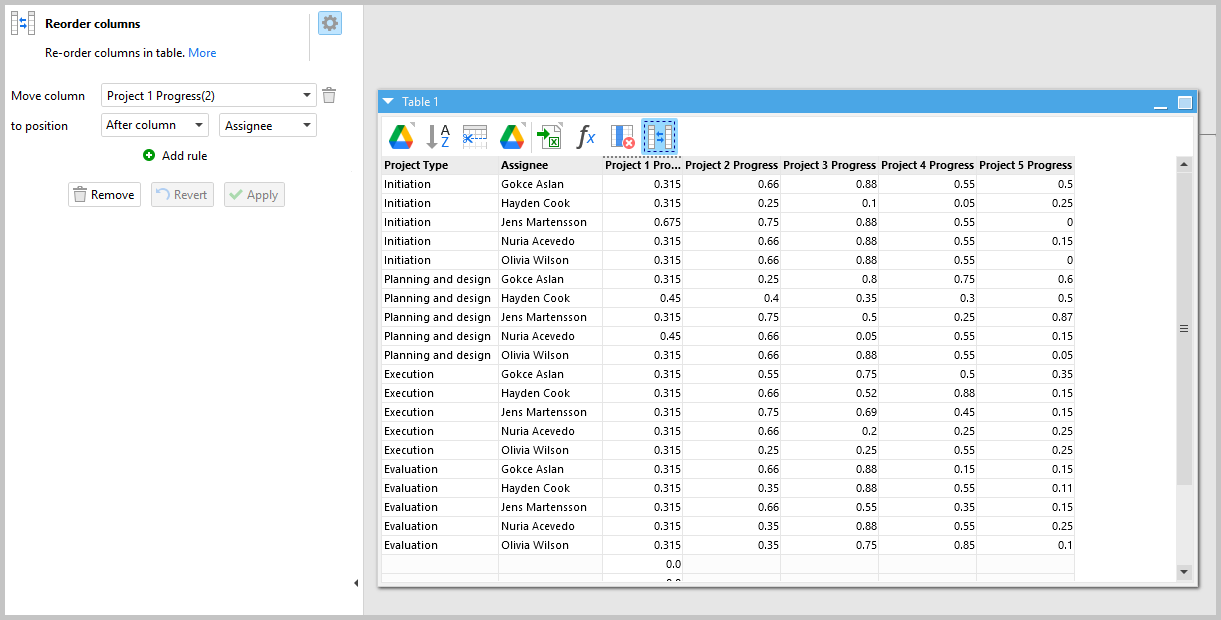
Now I'm left with the newly created data with values that are more representative of my team's progress.
This is how EasyMorph goes above and beyond what several other data manipulation tools cover. For example, Power Query is a capable tool for transforming data, but it only handles this part of the bigger process and misses out on file automation, scheduling, or delivery tasks — which EasyMorph can handle in a single workflow. EasyMorph does it all in one centralized place and it's visually auditable so you don't need technical expertise to understand what the workflow does.
Step 3: Update Your Excel Template
After you've transformed the data, you now need to write the data directly into your Excel template. And what makes this easier is that EasyMorph comes with a direct integration with Excel. Your static spreadsheet stays completely intact — it's just the data that changes. So you don't need any manual pasting, updated formulas, or reformatting to change the report.
Example:
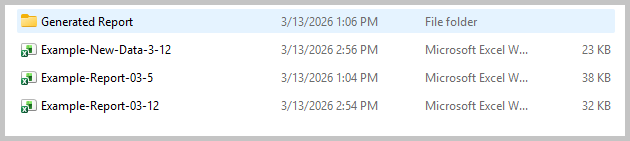
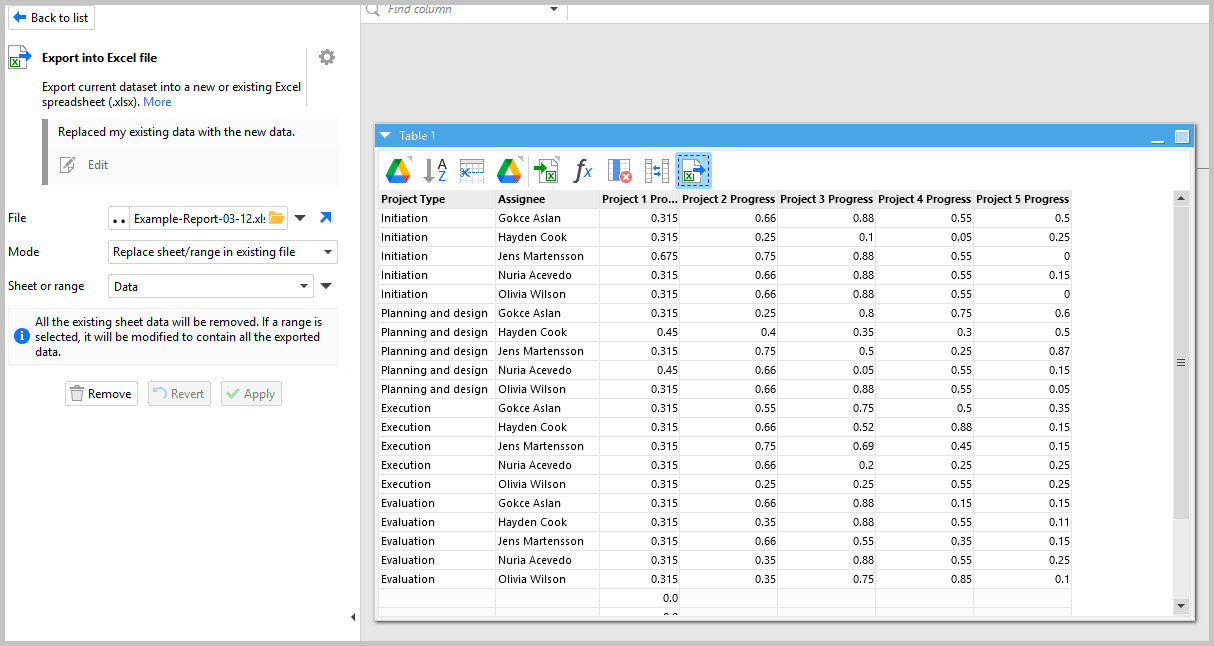
So here I'll export my data to my new Excel file. I copied my previous report, changed it to the recent report's date (March 12th) and inside EasyMorph I added the "Export to Excel file" action. I then selected "replace sheet/range in the existing file", selecting only the sheet that affects my data.
Important: Make sure Excel is closed before running the action or a dialogue box will open telling you the file is open in another program.
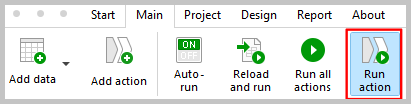
After this step, I can run the action by going to the top navigation bar and clicking "Run Action".
Your Excel report should be updated dynamically with the existing sheet. You can also add the Excel Command action at the end of your workflow and select to recalculate the workbook if it doesn't update automatically.
Here is the final product. First, we see the sheet with the corresponding data on the "Data" sheet.
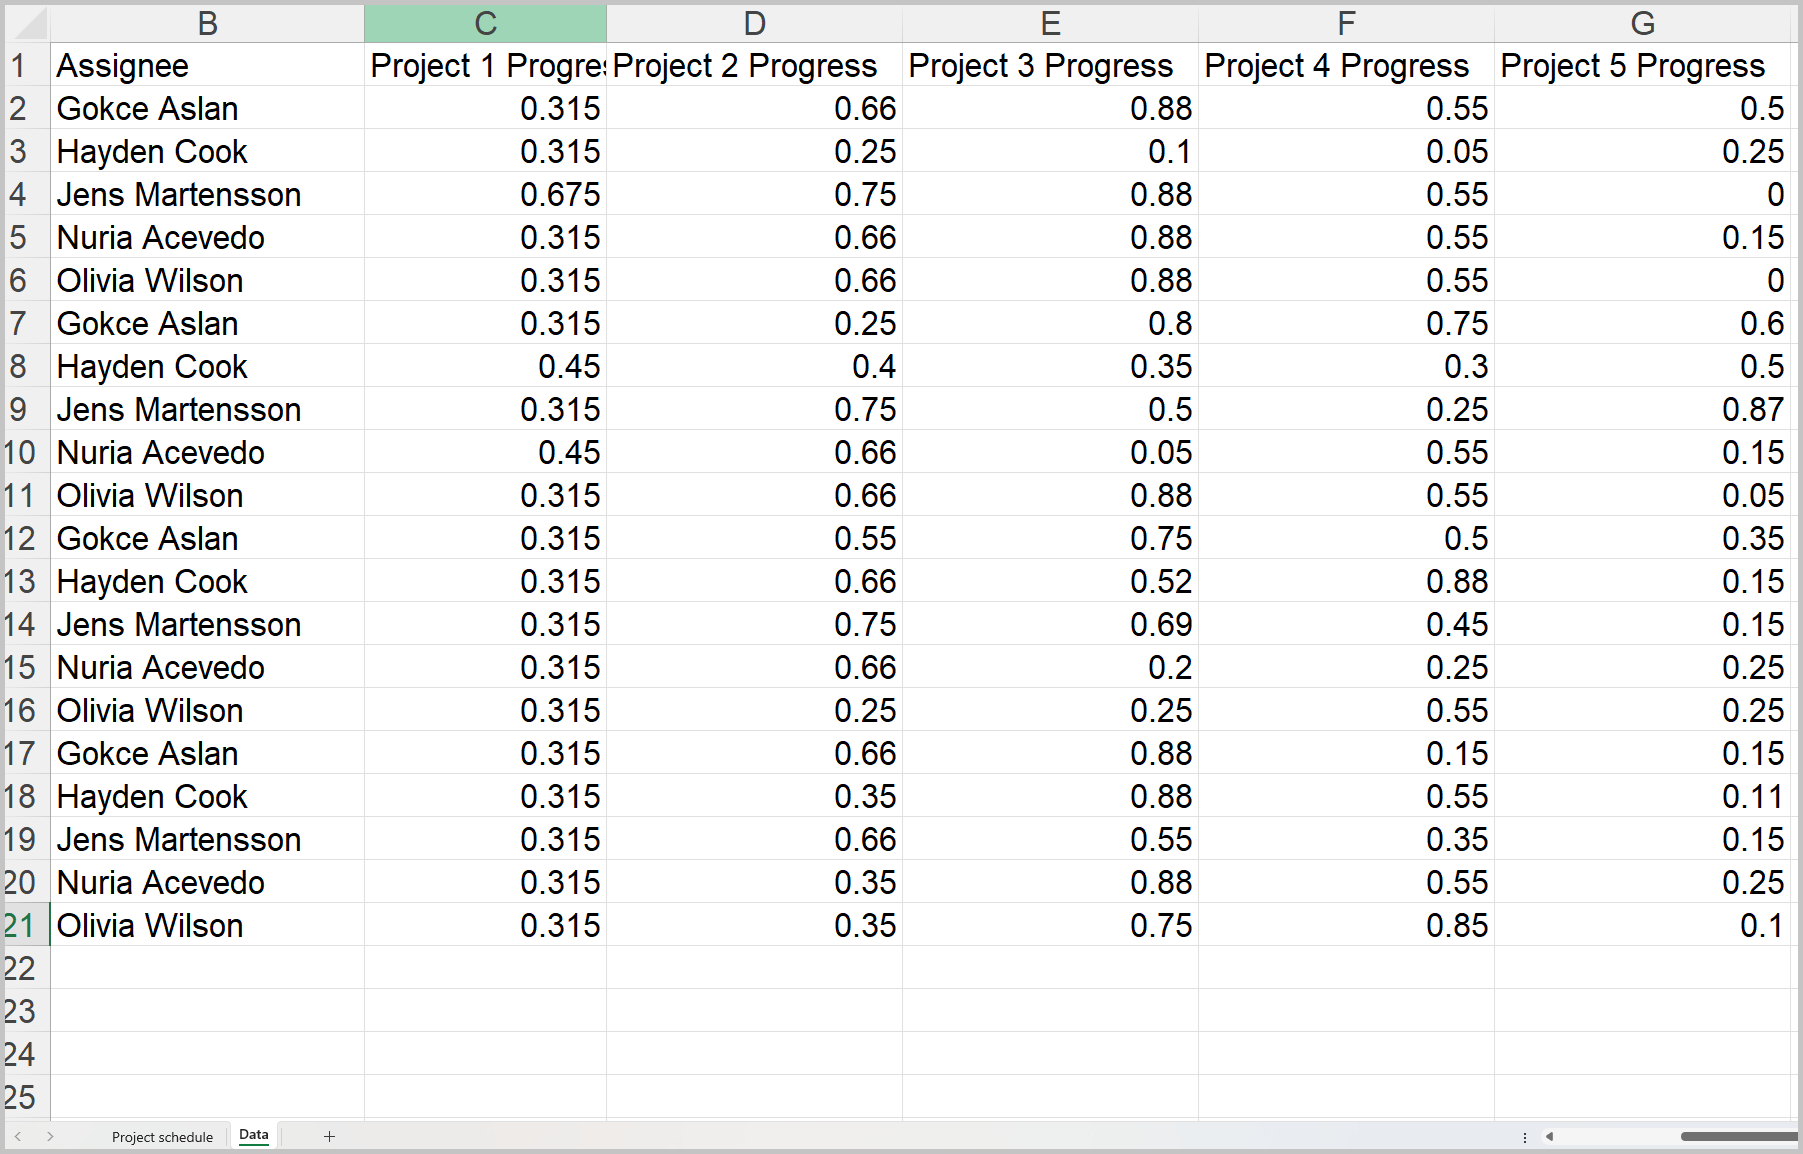
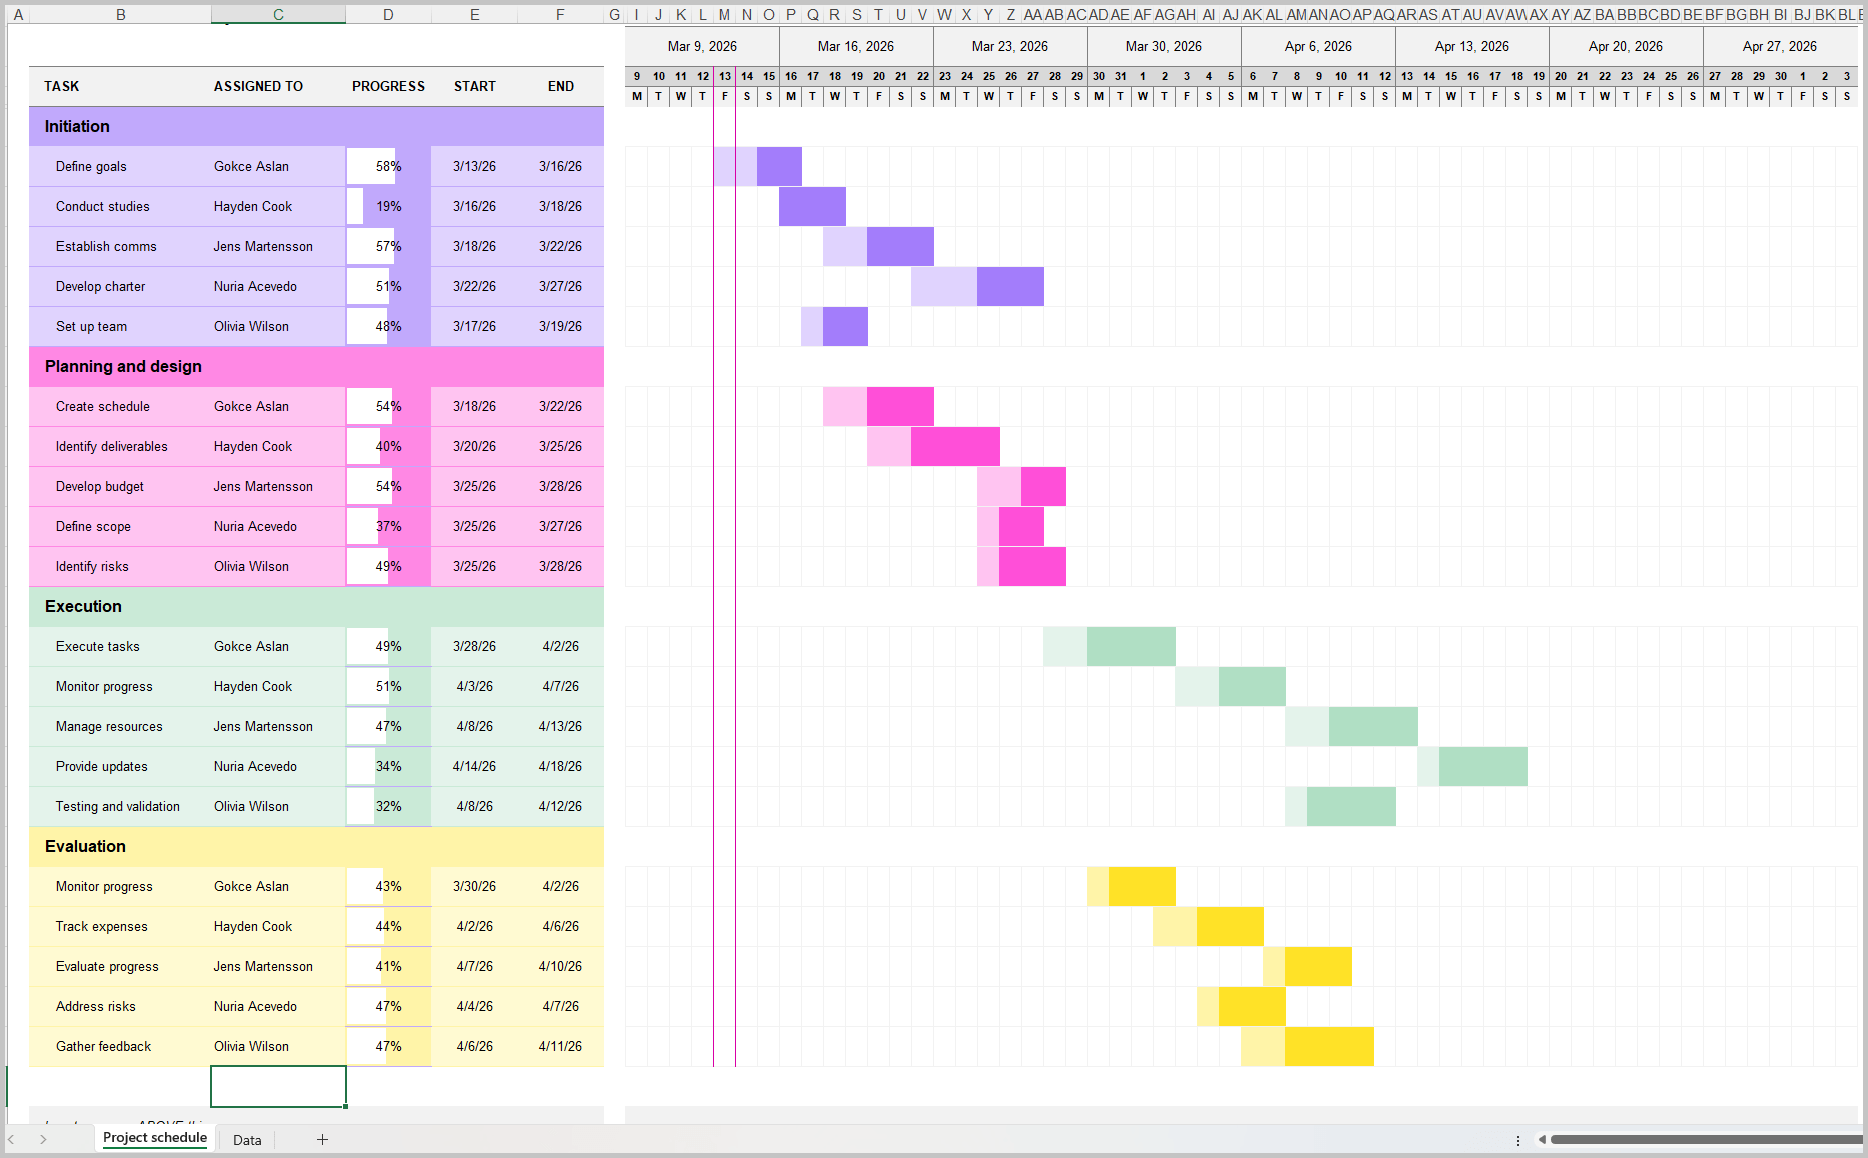
The great part about this step is that your reports will always look exactly the same, so it makes it easier to scan results and support faster business decisions.
Step 4: Distribute Automatically
Now the final step is delivering your report. EasyMorph can send the finished Excel workbook via email, upload it to a network drive or SharePoint, or publish it directly to a BI dashboard like Power BI or Tableau.
What to do:
In this case, I'm going to drop the report back to Google Drive. In the example below, I add the "Google Drive command" action, select my connected Google Drive, and the "Upload File" command. I change the file path to fit my newly generated report and choose the target folder of my choosing.
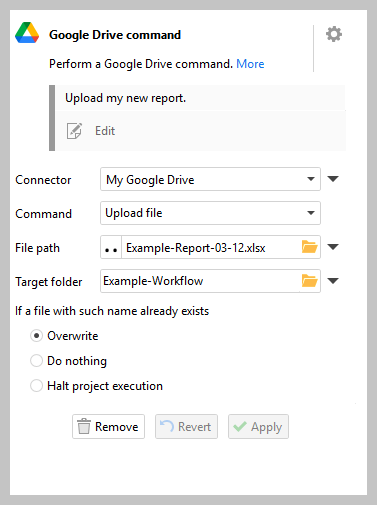
I then click "Run action" on the navigation bar.
And finally I should see the updated report inside Google Drive.

At the end of this distribution, you've now successfully created a dynamic workflow that will update an existing Excel report with new data and export or send the report to any place of your choosing. But we almost forgot the most important part — we need this to be automatic. So we need to schedule our workflow to run at a time or day of the week.
Scheduling and Running Your Workflow
To access the automatic scheduler called EasyMorph Launcher, you will need the Professional version of EasyMorph. EasyMorph Launcher lets you decide what day and time you want to run the workflow. It can be hourly, daily, or even weekly depending on the workflow or report you need to send.
What to do:
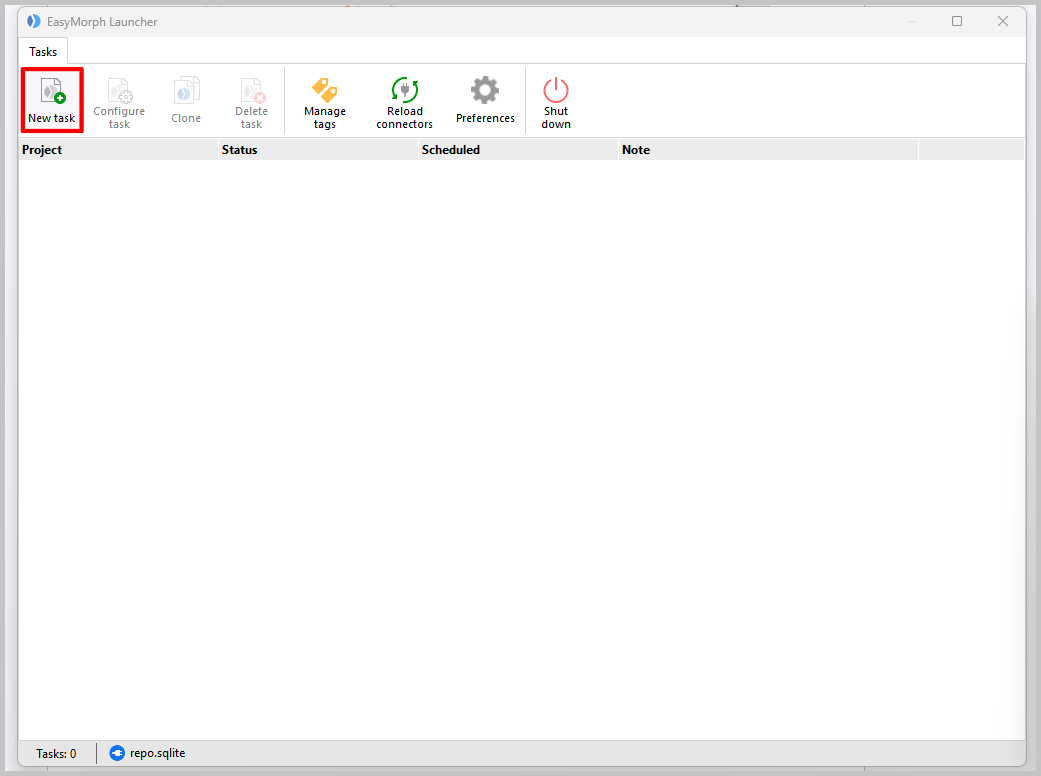
First I open up the EasyMorph Launcher and click New Task.
Inside the new task, I select the .morph file of the workflow we created above.
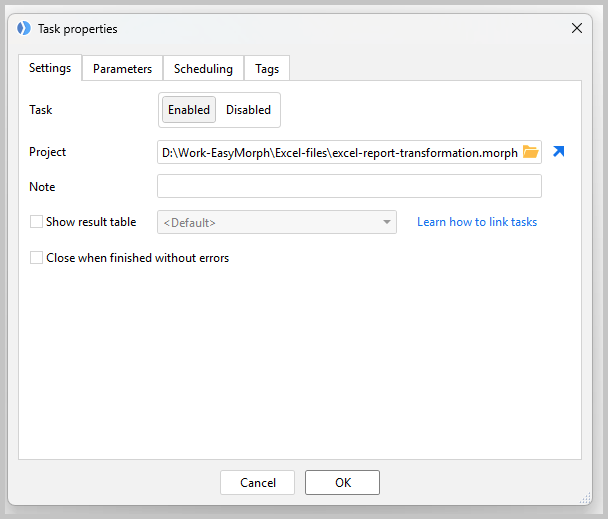
I then go to Scheduling and select the schedule for when I want my automation to run.
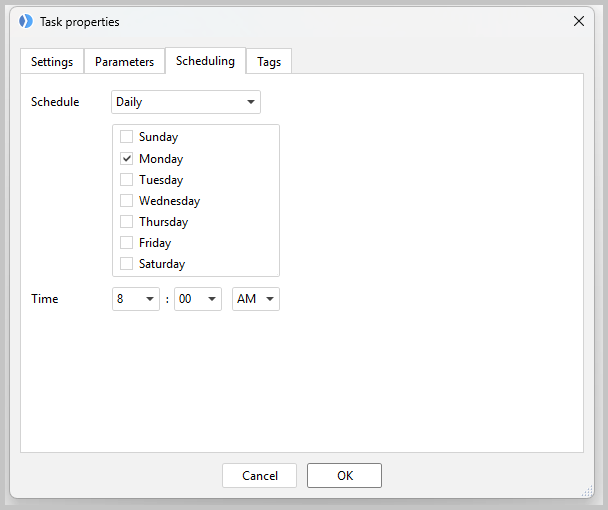
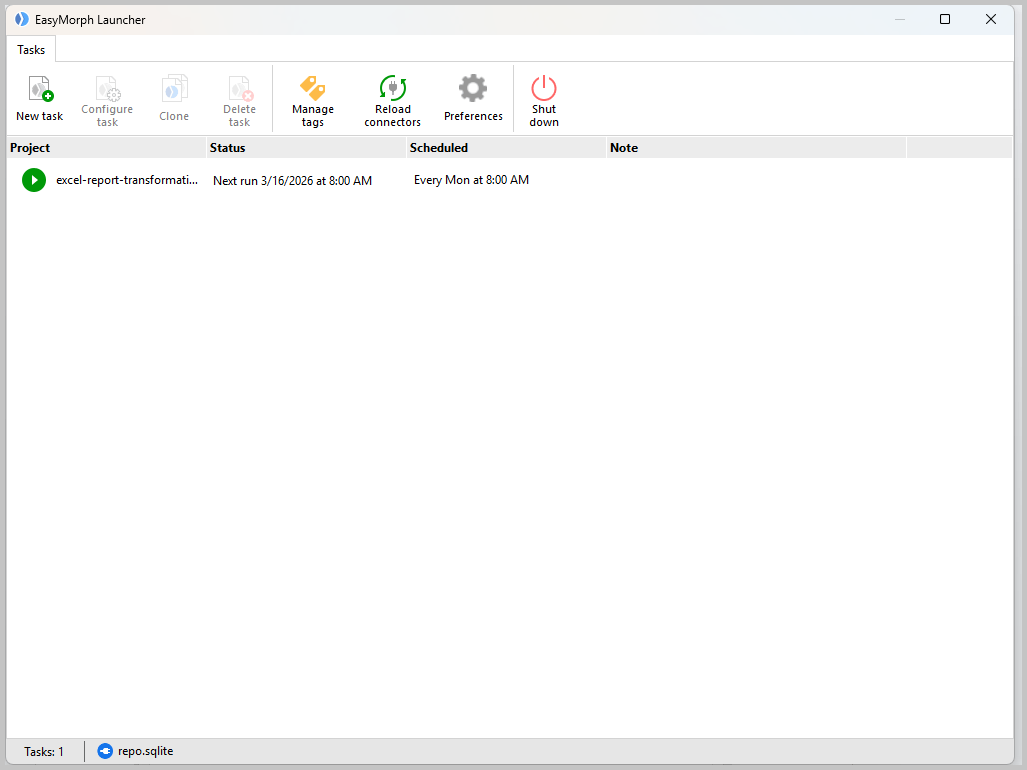
I click OK, and now the automated workflow should run every Monday at 8:00 AM.
Important: Keep in mind your computer or local machine must be on for the workflows in the launcher to run. If you need more automation capabilities than that, we recommend you look into EasyMorph Hub, which offers "always on" scheduling as well as monthly or event-based scheduling using triggers.
Now the entire reporting process from data ingestion to export runs without anyone touching it. Keep in mind you can replace any kind of data ingestion from emails, databases, SharePoint, and more rather than using Google Drive alone.
Using this automated workflow means you get your time back and management gets their reports on the day and time they always get it. No one has to manually build the same Excel report with new data, saving you a lot of time, money, and long days.
EasyMorph vs. Manual Excel Workflows: A Quick Comparison
Below is a quick summary of what a manual Excel workflow looks like versus one with EasyMorph:
| Capability | Manual Excel | Power Query | EasyMorph |
|---|---|---|---|
| Automated data ingestion | Manual | Limited; extra setup sometimes needed | Automatic |
| Pull from email / databases / SharePoint | Limited | ||
| Automated multi-source data blending | Manual | ||
| Scheduled, unattended runs | Limited; depends on Microsoft services | ||
| Auto-deliver reports via email | Not native | ||
| Error handling & logging | Basic errors; limited logging | ||
| No coding required | Coding required frequently | ||
| Reusable, shareable workflows | Limited |
Start Automating Your Reports Today
Automating your Excel reports shouldn't require a developer or a complex enterprise platform. With EasyMorph, you can build your entire Excel report workflow in minutes and automate it so it runs on a regular schedule at the time and destination of your choosing. Simply connect your raw data sources, transform the data, update your Excel workbook, and send your report where it needs to go.
The first time you generate a report automatically, you'll be asking yourself why you ever did it manually!
Ready to automate reports and get your time back?
Try EasyMorph free and build your first automated workflow today.